Making data accessible via API
In addition to providing tools to maintain metadata via API, NADA provides a solution to store and disseminate data via API. In the current version of NADA, this solution applies to indicators/time series and tabular data. It could also be implemented to microdata (this option is not documented here, but will be added in future versions of the documentation).
Making your data accessible via API has multiple advantages:
- Many data users will appreciate such mode of access; all modern data dissemination systems provide an API option.
- By making your data accessible programatically, you provide new opportunities to data users, which will increase the use and value of your data.
- The API can be used internally by your NADA catalog, to create dynamic visualizations, display data, and create on-line data extraction tools.
NADA stores the data and the related data dictionary in a mongoDB database (an open source software). To make use of the data API solution, mongoDB must have been installed on your server. See the Installation Guide for more information.
Publishing data in mongoDB and making them accessible via API is a simple process that consists of:
- Preparing your data: data must be stored in a CSV file (or a zipped CSV file) and organized in a long format. The content of this CSV file will be a "table" in mongoDB.
- The CSV (or zip) file is published in a mongoDB database using the NADAR package (for R users) or the PyNADA library (for Python users). A name will have to be given to the database. A database can contain multiple tables. There is currently no option to publish data to mongoDB using the NADA web interface.
- A data dictionary is created (in R or Python) and published together with the data.
- The data is then accessible via API.
Formatting and publishing time series data
Time series / indicators will typically come in a format suitable for publishing in the NADA API. The CSV data file must include (i) the series’ unique identifier, (ii) the series features (or dimensions), and (iii) the value.
- The identifier will be a string or a numeric variable that provides a unique identifier for the series/indicator. For example, the World Bank’s identifier for the Population, Total series of the World Development Indicators (WDI) database is SP.POP.TOTL. It is SP.POP.TOTL.FE.IN for the female population and SP.POP.TOTL.MA.IN for the male population.
- The features (or dimensions) of the series/indicator are additional qualifiers of the values of the series/indicator. For example, the features for the Population, Total series could be “country_name”, “country_code”, and “Year”. The features are the information that, combined with the series identifier, will provide the necessary information to define what a given value represents.
- The value is the estimate that corresponds to the series and its features.
Example:
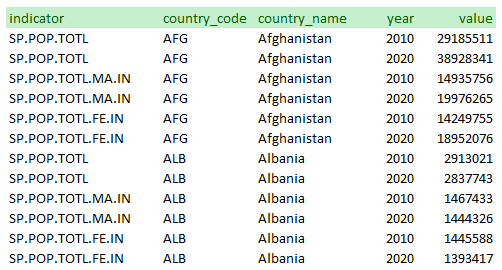
Note that the database could have be organized differently. The WDI database generates separate series for “Population, Total”, “Population, Male”, and “Population, Female”. Another option would have been to create one series “Population” and to provide the sex as a feature:
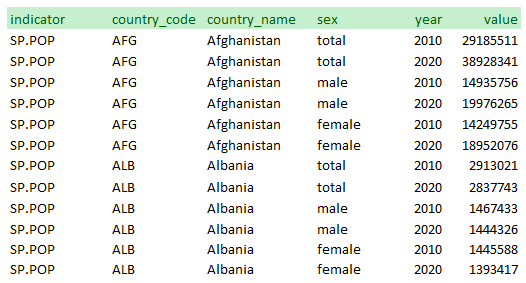
To be published in the NADA data API (as a mongoDB table), the data must first be formatted and saved as a CSV file. The data must be organized as displayed in the examples above, i.e. in a long format (by opposition to a wide format). This means that:
- the data file must have one and only one value per row
- the combination of the series/indicator identifier with the features cannot contain duplicates (in the example above, this means that each combination of series + country_code + country_name + year must be unique in the data file; this will guarantee for example that we would nnot have two different values for the total population of Afghanistan for a same year).
Note that a CSV file may contain more than one series/indicator.
For efficiency reason (reduced file size and speed of data filtering and extraction), it is recommended to store the information in the CSV file as numeric variables whenever possible. In our example, instead of storing the sex feature as a string variable with categories “total”, “male”, and “female”, we could store it as 0 (for total), 1 (for male), and 2 (for female). Also, the country_name variable could be dropped, as the country_code variable provides the necessary information (as long as the user is provided with the country name corresponding to each code). A data dictionary will always be uploaded with the CSV file, which will contain the necessary data dictionnary.
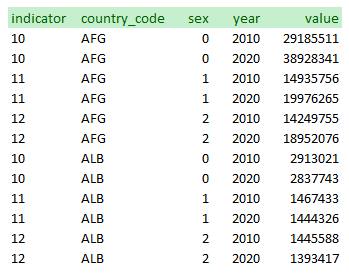
When published in mongoDB, the CSV file will be provided with the following core metadata:
- A unique table identifier (the table refers to a mongoDB table; it corresponds to the dataset being published, which may contain one or multiple time series/indicators).
- The table (dataset) title
- An optional (but recommended) description of the table (dataset).
- A description of the indicator for which values are provided, including a label and a measurement unit.
- A data dictionary containing the variable and value labels for all features (dimensions), except when the value labels are available in a separate lookup file (see section "Using lookup files" below).
Using R
Description of the NADAR function: data_api_create_table( db_id, table_id, metadata, api_key = NULL, api_base_url = NULL ) Arguments db_id (Required) database name table_id (Required) Table name metadata Table metadata
library(nadar)
library(readxl)

# ------------------------------------------------------------------------------
# Set API key (stored in a CSV file; not to be entered in clear) and catalog URL
my_keys <- read.csv("C:/confidential/my_API_keys.csv", header=F, stringsAsFactors=F)
set_api_key(my_keys[2,2])  # Assuming the key is in cell B2
set_api_url("https://nada-demo.ihsn.org./index.php/api/")
set_api_verbose(FALSE)
# ------------------------------------------------------------------------------

tblid = "POP_2010_2020"
csv_data = "C:\test_files\POP_SEX_2010_2020.CSV"

# Generate the table metadata

my_tbl <- list(

  table_id    = tblid,
  title       = "Population by sex, 2010 and 2020, Afghanistan and Albania",
  description = "The table provides population data for two countries, in 2020 and 2020.
	         Source: World Bank, World Development Indicators database, 2021",

  indicator = list(
	list(code   = 10,
             label  = "Population, Total",
             measurement_unit = "Number of persons"),
	list(code   = 11,
	     label  = "Population, Male",
	     measurement_unit = "Number of persons"),
	list(code   = 12,
	     label  = "Population, Female",
	     measurement_unit = "Number of persons")
  ),

  features = list(

    list(feature_name  = "country_code",
         feature_label = "Country",
         code_list = list(list(code="AFG", label="Afghanistan"),
                          list(code="ALB", label="Albania"))),

    list(feature_name  = "sex",
         feature_label = "Sex",
         code_list = list(list(code=0, label="All"),
                          list(code=1, label="Male"),
                          list(code=2, label="Female")))

    list(feature_name  = "year",
         feature_label = "Year")

  )

)

# Publish the CSV file to MongoDB database
publish_table_to_MongoDB(tblid, csv_data, my_tbl)
Using Python
Description of the PyNADA function: @@@
# Same example, in PythonFormatting and publishing tabular data
The content of statistical tables (cross-tabulations), when it can be converted to a long format, can also be published in the data API. We provide here a simple example. Using R or Python, the format of statistical tables can be reshaped to match the requirements of the NADA data API, saved as CSV, and published in mongoDB. We provide here a simple example.
The source table 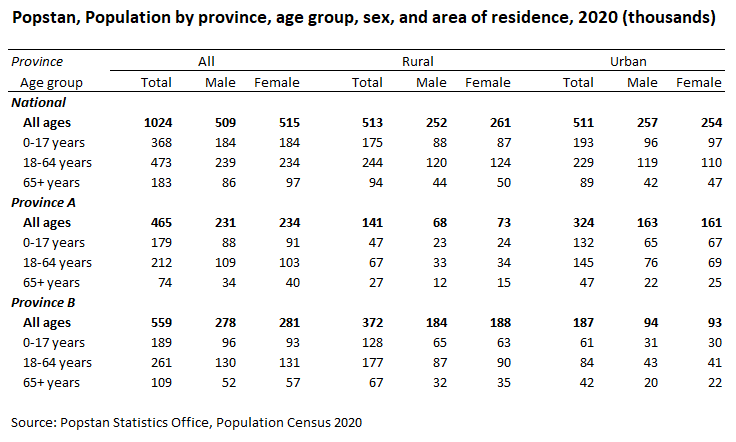
The table contains 108 cells with values. When converted to a long format, we therefore expect to have 108 observations in the resulting CSV file. The indicator is “population”. The features are the province (including the total), the age group (with 4 possible values), the area of residence (with 3 possible values), and the sex (with 3 possible values). The conversion to the long format can be done in Excel, or programmatically (Excel, R, Python, Stata, SPSS, etc. provide tools to reshape tables and to encode variables).
Note: empty/missing values in CSV … Note: do not round
Rule: most detailed and full transparency to users (when they see a value, they need to know what it represents).
Converted to long format 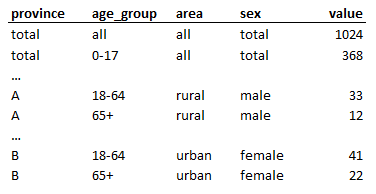
Optimized (encoded strings) 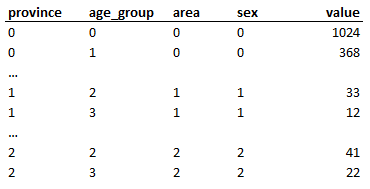
Using R
library(nadar)
library(readxl)

# ------------------------------------------------------------------------------
# Set API key (stored in a CSV file; not to be entered in clear) and catalog URL
my_keys <- read.csv("C:/confidential/my_API_keys.csv", header=F, stringsAsFactors=F)
set_api_key(my_keys[2,2])  # Assuming the key is in cell B2
set_api_url("https://nada-demo.ihsn.org./index.php/api/")
set_api_verbose(FALSE)
# ------------------------------------------------------------------------------

tblid = "POP_AGE_2020"
csv_data = "C:\test_files\POP_AGE_2020.CSV"

# Generate the table metadata

my_tbl <- list(

  table_id    = tblid,
  title       = "Popstan, Population by province, age group, sex, and area of residence, 2020 (thousands)",
  description = "The table provides data on the resident population of Popstan as of June 30, 2020,
                 by province, age group, area of residence, and sex.
                 The data are the results of the population census 2020.",

  indicator = list(list(code   = 1,
                        label  = "Population",
                        measurement_unit = "Thousands of persons")),

  features = list(

    list(feature_name  = "province",
         feature_label = "Province",
         code_list = list(list(code=0, label="All"),
                          list(code=1, label="Province A"),
                          list(code=2, label="Province B"))),

    list(feature_name  = "area",
         feature_label = "Area of residence (urban/rural)",
         code_list = list(list(code=0, label="All"),
                          list(code=1, label="Rural"),
                          list(code=2, label="Urban"))),

    list(feature_name  = "age_group",
         feature_label = "Age group",
         code_list = list(list(code=0,  label="Total"),
                          list(code=1,  label="0 to 17 years"),
                          list(code=2,  label="18 to 64 years"),
                          list(code=3,  label="65 years and above"))),

    list(feature_name  = "sex",
         feature_label = "Sex",
         code_list = list(list(code=0, label="All"),
                          list(code=1, label="Male"),
                          list(code=2, label="Female")))
  )

)

# Publish the CSV file to MongoDB database

publish_table_to_MongoDB(tblid, csv_data, my_tbl)
Example using Python
Using lookup files
@@@@@ For long lists of value labels (such as detailed, nested geographic codes): instead of long data dictionary, refer to a table in database.
Example: Census data with population total, by state, district, sub-district, town (urban) or village (rural). System with nested codes. Can be thousands of observations. (show table). Not only very long list, also used for multiple tables.
Another example would be a list of occupations, or industries, used in many tables (national or international classifications, which can be long). Many tables can use the same classification.
In such cases, it would be too tedious and inconvenient to produce a data dictionary in R or Python script.
To do that: ...
Deleting a mongoDB table
@@@ NADAR: data_api_delete_table(db_id, table_id, api_key = NULL, api_base_url = NULL) Arguments: db_id (Required) database name table_id (Required) Table name
Replacing a mongoDB table
@@@ overwrite = "yes" in NADAR data_api_publish_table( db_id, table_id, table_metadata, csvfile, overwrite = "no", api_key = NULL, api_base_url = NULL )
Appending to a mongoDB table
@@@ Not yet implemented.
Listing tables available in mongDB
NADAR: data_api_list_tables(api_key = NULL, api_base_url = NULL)
PyNADA:
Web browser: You can view a list of all tables published in your catalog's mongoDB database by entering the following URL in your browser (after replacing "nada-demo.ihsn.org" with your own catalog URL): https://nada-demo.ihsn.org/index.php/api/tables/list. A list of all tables with some summary information on each table will be displayed.
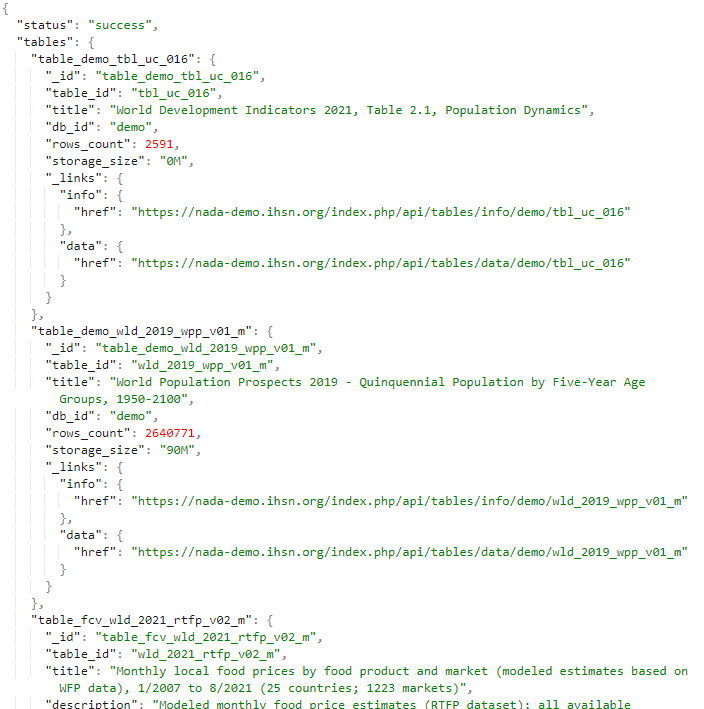
Retrieving metadata on a table
@@@ https://nada-demo.ihsn.org/index.php/api/tables/info/demo/tbl_uc_016
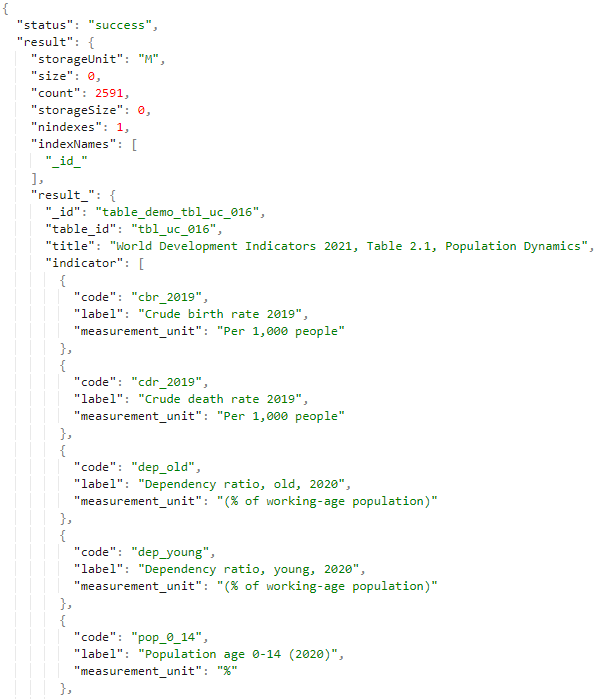
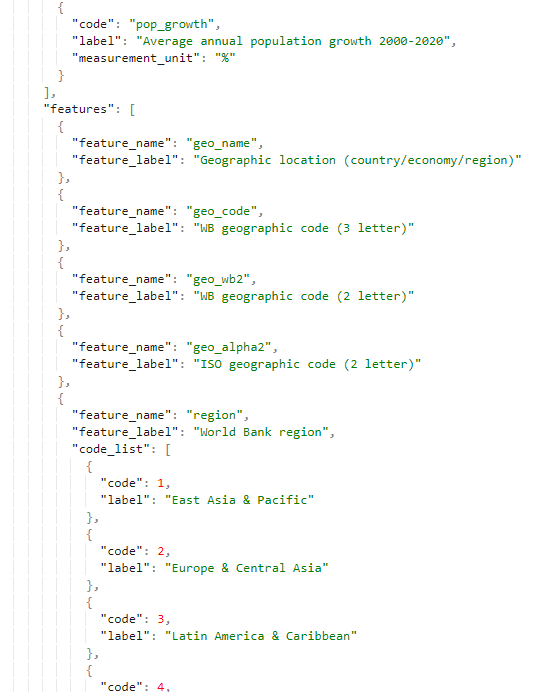
Viewing data in JSON
https://nada-demo.ihsn.org/index.php/api/tables/data/demo/tbl_uc_016
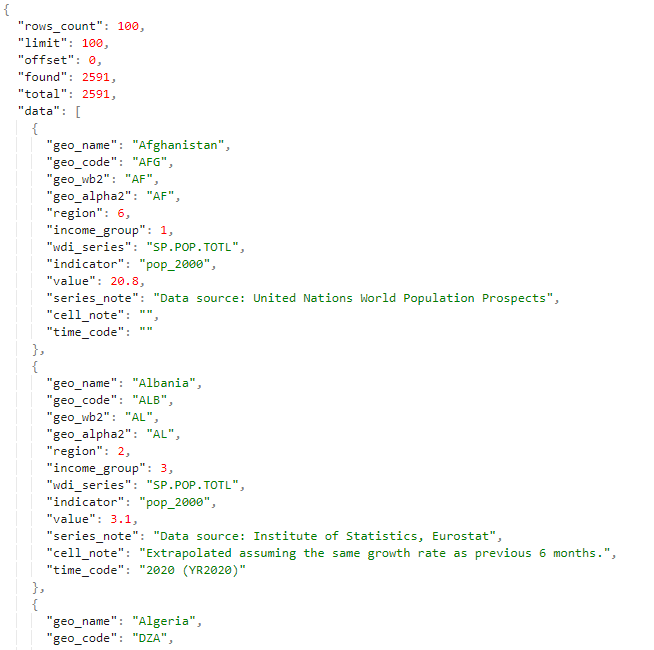
Querying the data
@@@
The API will extract data from a database where each cell of each table represents an observation. Some tables contain thousands or even millions of observations. By building and running an API query, you will filter and extract the observations and variables that match your criteria. To build such a filter, you will need (i) the list of variables available in the table, and (ii) the codes used for each variable. For example, if you are interested in extracting ...
Build your query
The information on variables and codes gives you what you need to build your query. The query will always be structured as follows: [base URL][/maximum number of observations (optional)][?][your query][format of data]
The base URL will always be [URL]
The maximum number of observations is an optional parameter. By default, the API will return only the first 400 observations (the rest being available in subsequent pages]. To change this parameter, enter "/" followed by the number.
Your query will start with a "? followed by a list of filters describing the variables and values of interest. This filter can use the operators "AND", "OR", and "!" (not). To select multiple values for a variable, use the "," as a separator or "-" to define a range. For example, to select ...
To list the variables you are interested in, enter "features=" followed by a list of variables separated by commas.
Last, select the format in which you want the data to be returned by the API; the options are "format=JSON" or "format= CSV".
In our example, assume we want ...
Informing and guiding users
Users will need some instructions to make use of the data API. What to provide? @@@@
A note on SDMX compatibility
@@@@