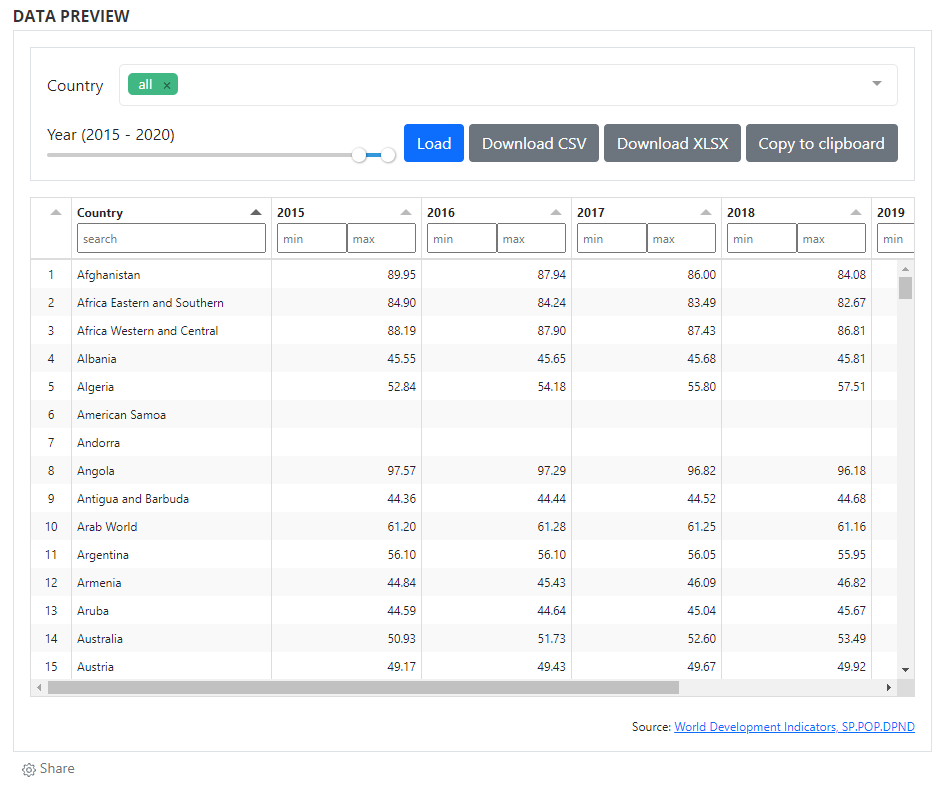
Visualizations and data preview
For widget packaging and the Widgets API, see also Widgets and Widgets API.
Dynamic visualizations such as charts and maps can be added to a catalog entry page using widgets. The use of widgets is only possible via the API (this cannot be done through the administrator interface). The visualizations are generated outside NADA, for example using a JavaScript library. NADA itself does not provide a tool for creating visualizations; it only provides a convenient solution to embed visualizations in catalog pages. The NADA demo catalog includes such visualizations. See for example:
https://nada-demo.ihsn.org/index.php/catalog/49 (line/bar chart, choropleth map, data preview)
https://nada-demo.ihsn.org/index.php/catalog/87 (choropleth map)
https://nada-demo.ihsn.org/index.php/catalog/97 (age pyramid)
Visualizations can however be applied to any data type, as long as the underlying data are available via an API (the NADA data API, or an external API).
The widgets (zip files) used in the NADA demo catalog are available in the NADA GitHub repository (Use Cases).
Requirements
A visualization widget can be added to a catalog page in two steps. First, upload a zipped widget source file to a catalog. Second, attach the widget to entry page(s). A zipped widget file contains one [index.html]{.underline} file, and supporting files such as a CSS and a thumbnail image.
In R:
library(nadar)

widgets_create
uuid = widget_uuid,

options = list(
   title = "title of widget",
   thumbnail = "thumbnail.jpg",
   description = "description of widget"
),

zip_file = zip_file

)

widgets_attach(
   idno = dataset_id,
   uuid = widget_uuid
)
In Python:
import pynada as nada

nada.upload_widget(
widget_id = widget_uuid,
title = " title of widget ",
file_path = zip_file,
thumbnail = "thumbnail.JPG",
description = " description of widget "
)

nada.attach_widget(
dataset_id = dataset_id,
widget_id = widget_uuid,
)
With the widget APIs, you can manage widgets and attachments separately. Oftentimes, many entry pages have a common data API and a same type of visualization, in which case a single widget can be used to display different datasets by reading the dataset ID that the widget is attached to as follows:
datasetID = parent.document.getElementsByClassName('study-idno')[0]
Thus, it is advisable to codify key contents of entry pages, such as country names and indicator series, and include the codes in dataset IDs so that a widget can load different data with the codified parameters from data API.
Since a widget is a self-sufficient web application, it is possible to import any JavaScript libraries to visualize data. It is also desirable to utilize a front-end framework (ex. Vue JS) and a CSS framework (ex. Bootstrap JS) to implement a JavaScript widget in a more structured way. The following examples are implemented using open-source Java libraries including jQuery, Vue, Bootstrap, eCharts (chart), Leaflet (map), and Tabulator (grid). Other libraries/frameworks could be used.
Example 1: eCharts bar/line chart

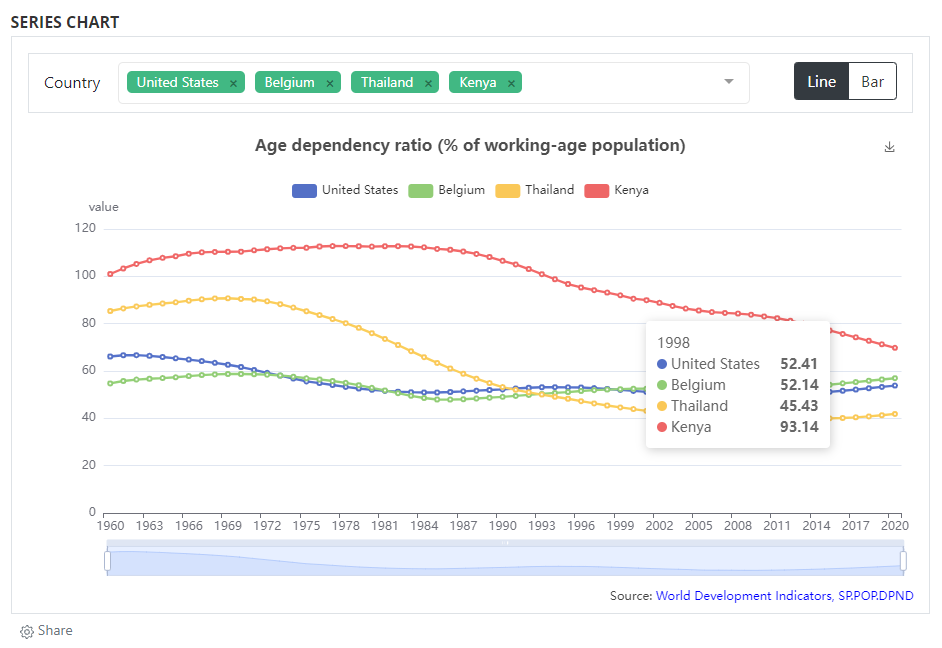
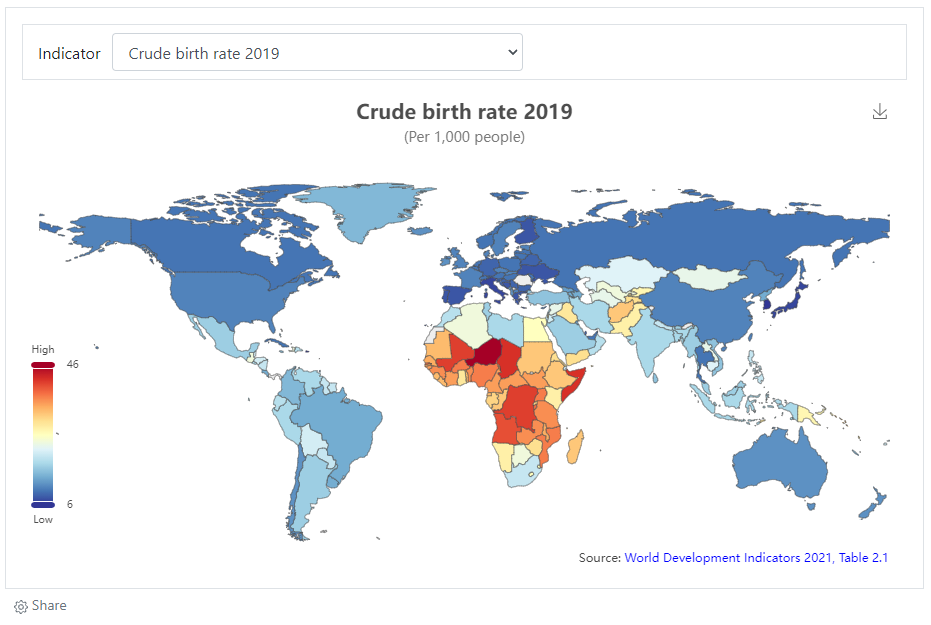
Example 2: eCharts map

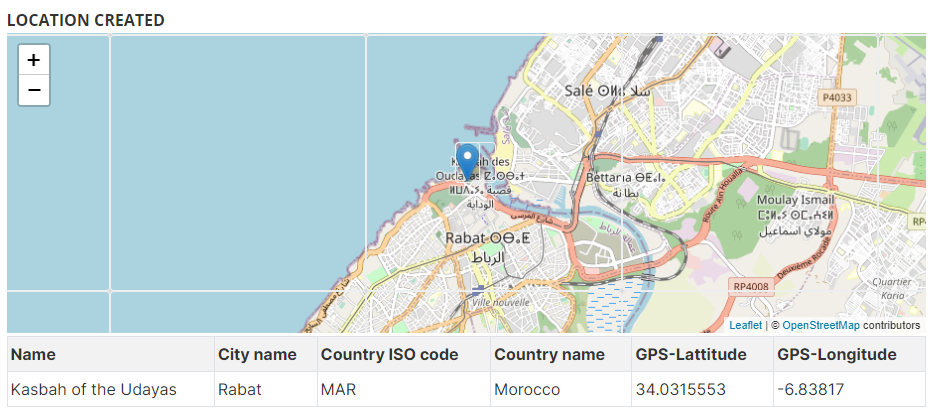
Example 3: location of image in a OSM map

Other examples
Demo catalog ; links to GitHub
Adding a data preview grid
For time series / indicators
The grids are generated outside NADA. In the example below, the grid produced using the open-source W2UI application. Other applications could be used, such as Grid JS, Tabulator, or other (including commercial applications). NADA itself does not provide a tool for generating data grids; it only provides a convenient solution to embed grids in catalog pages.