Tutorial: your first indicator
In this tutorial you publish the World Bank indicator SI.POV.DDAY, Poverty headcount ratio at $3.00 a day (2021 PPP) (% of population), for 183 countries, directly in NADA. It takes about 15 minutes.
You will:
- import a data structure and its country codelist;
- create the indicator from its metadata file;
- upload its data;
- add a thumbnail and publish;
- explore the indicator in the catalog;
- see what happens when you upload different data.
If you are new to indicators, read Key concepts first. It uses the same example.
Before you begin
- NADA 5.6 or later, with MongoDB set up: see MongoDB setup. The screenshots are from NADA 5.7.
- A NADA account with permission to add and publish studies, and to manage data structures.
- The sample files: download try_indicators.zip and unzip it. The files are described in the sample README.
Step 1: Import the data structure
The data structure tells NADA what each column of the data means. The sample's data structure also contains the list of country codes and names.
- In the admin, go to Settings → Data structures.
- Click Import JSON and choose
SI.POV.DDAY_dsd.json. - Leave Overwrite off and click Import.
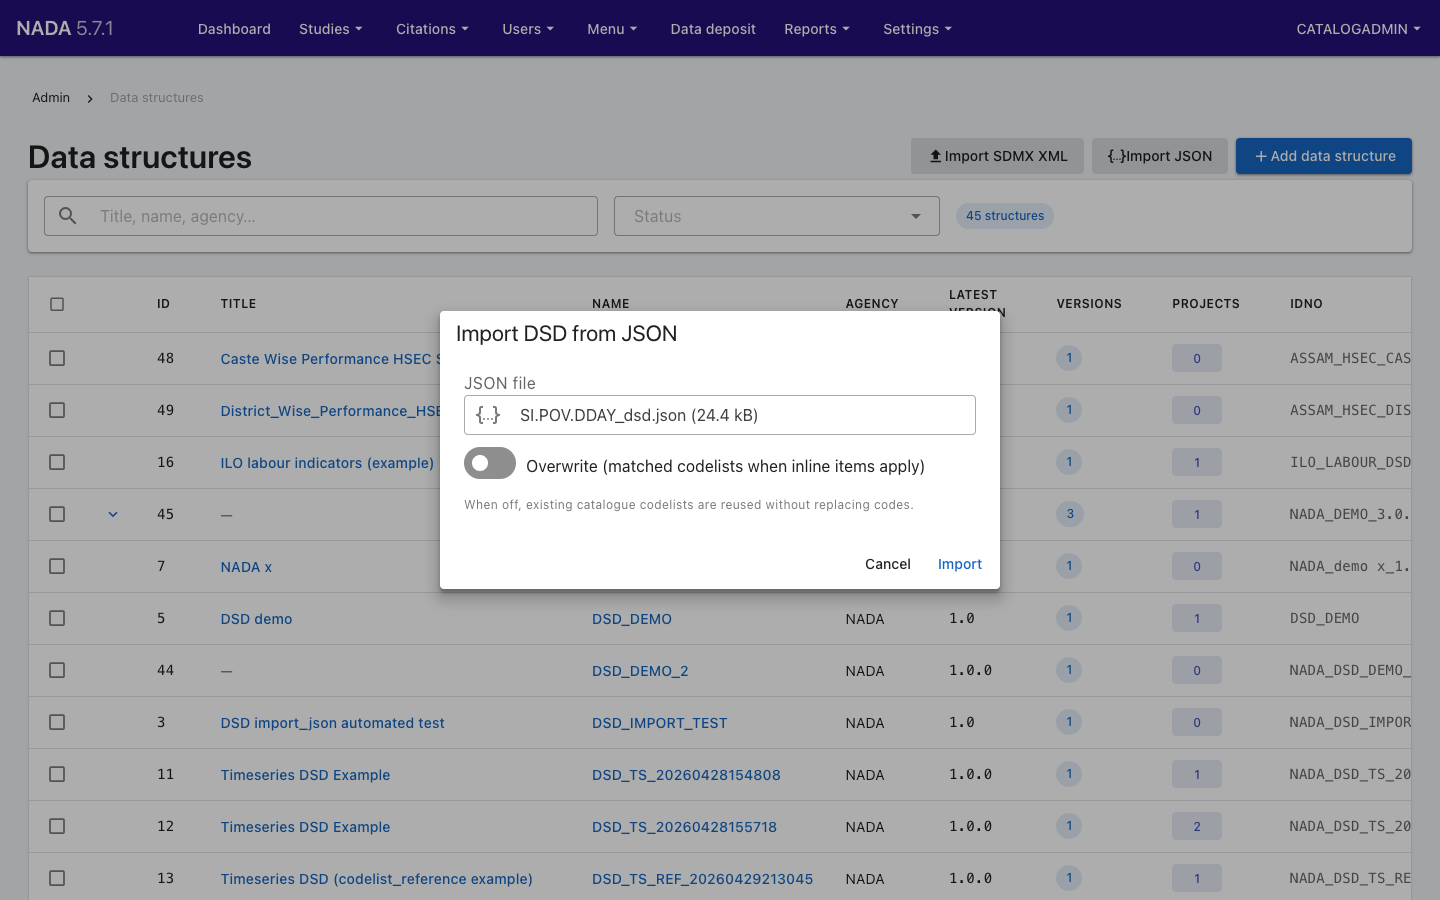
NADA shows Import finished. Codelists touched: 1. and opens the new data structure, WDI indicators by country and year. It has five Components: INDICATOR, INDICATOR_LABEL, REF_AREA, YEAR and VALUE. Its status is Draft.
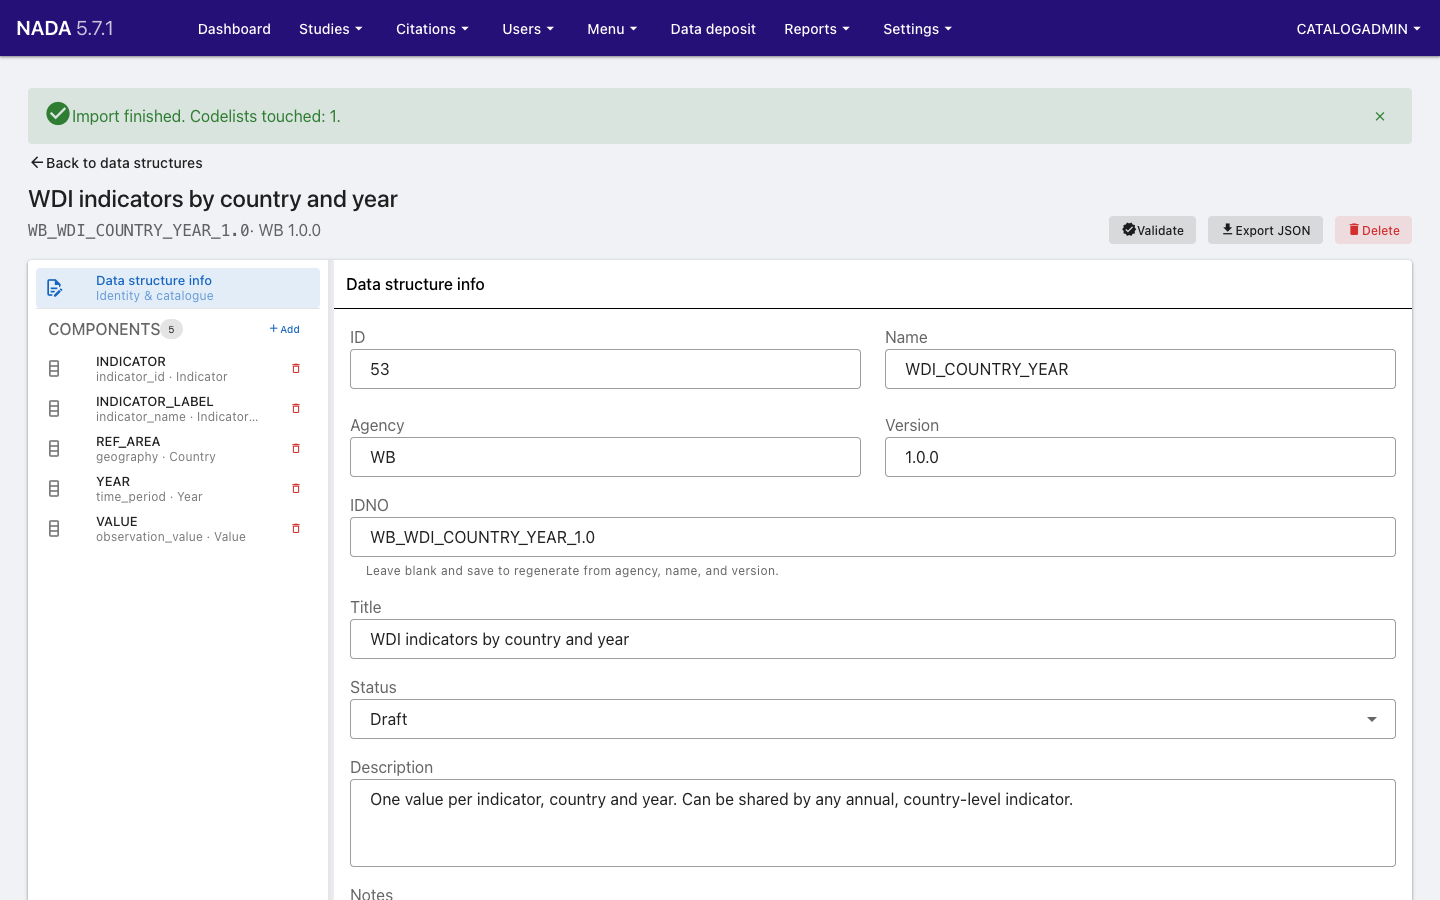
Check:
Click
REF_AREA. Its Column type isgeography, and its Codelist isCL_REF_AREA(WB_CL_REF_AREA_1.0), whose codes are listed below.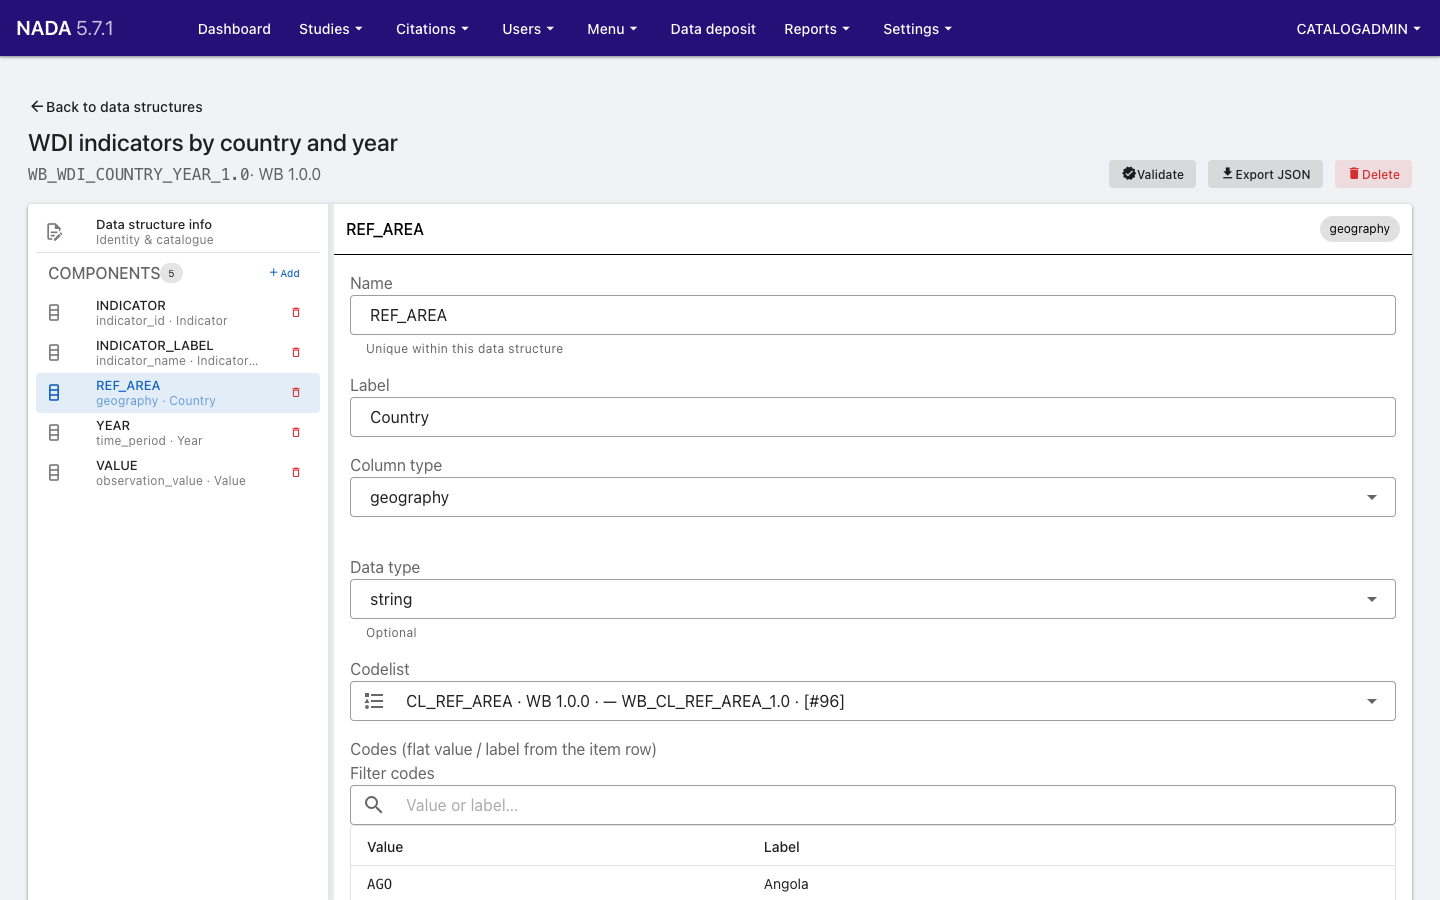
Click Validate. NADA shows Validation passed.
Already imported?
If the import says the data structure already exists, it was imported before. Use the existing one and continue.
Step 2: Create the indicator from its metadata file
The file SI.POV.DDAY_metadata.json holds the indicator's metadata. It also names the data structure the indicator uses.
- Go to Studies → Manage studies and click Add study.
- Under Import from file, choose the Collection, then choose
SI.POV.DDAY_metadata.jsonas the Metadata file. - Click Submit.
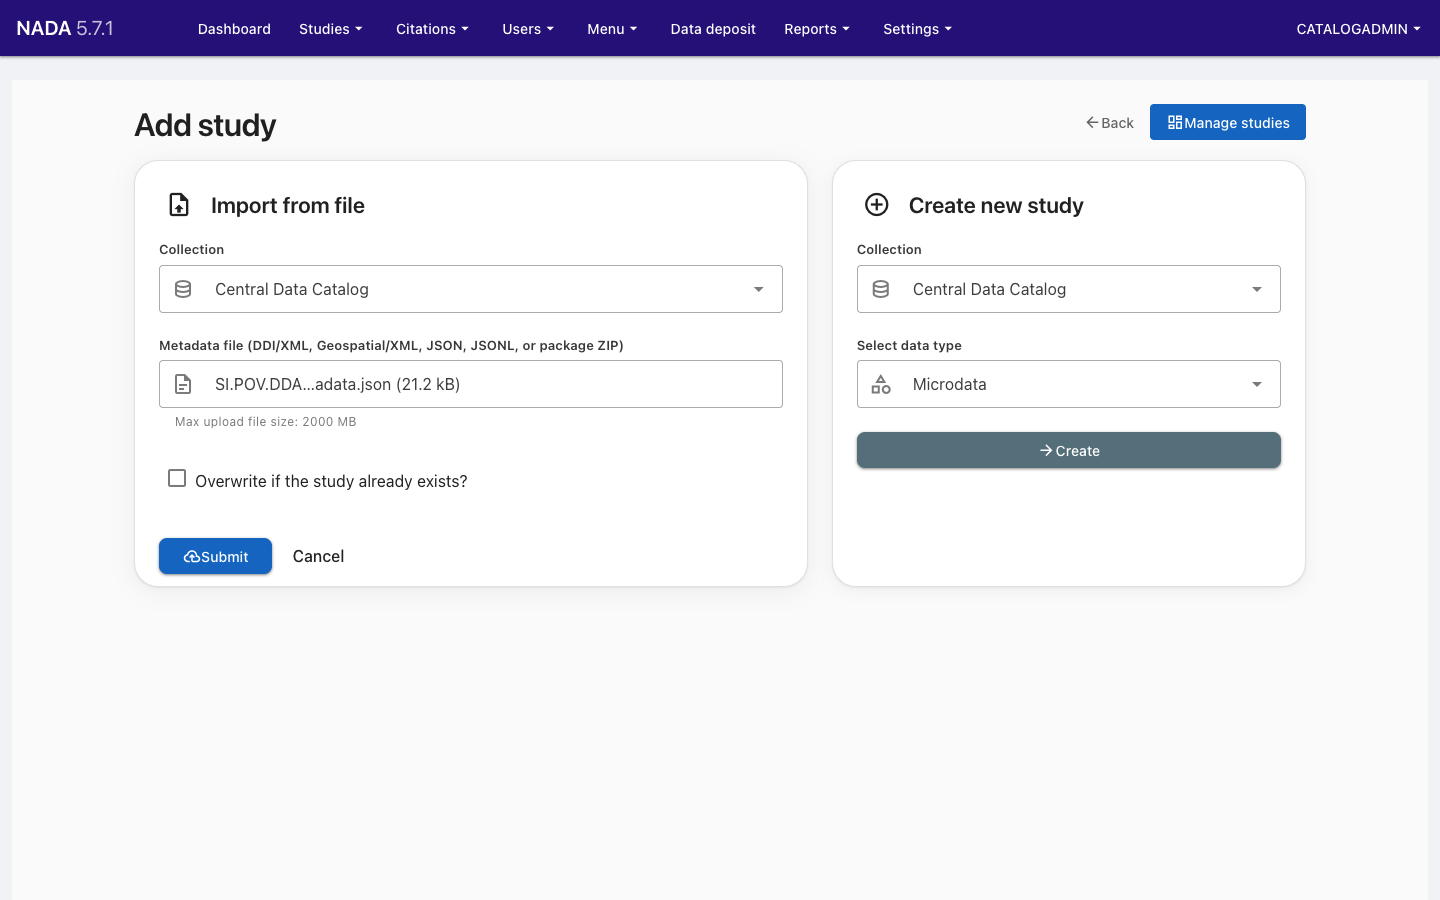
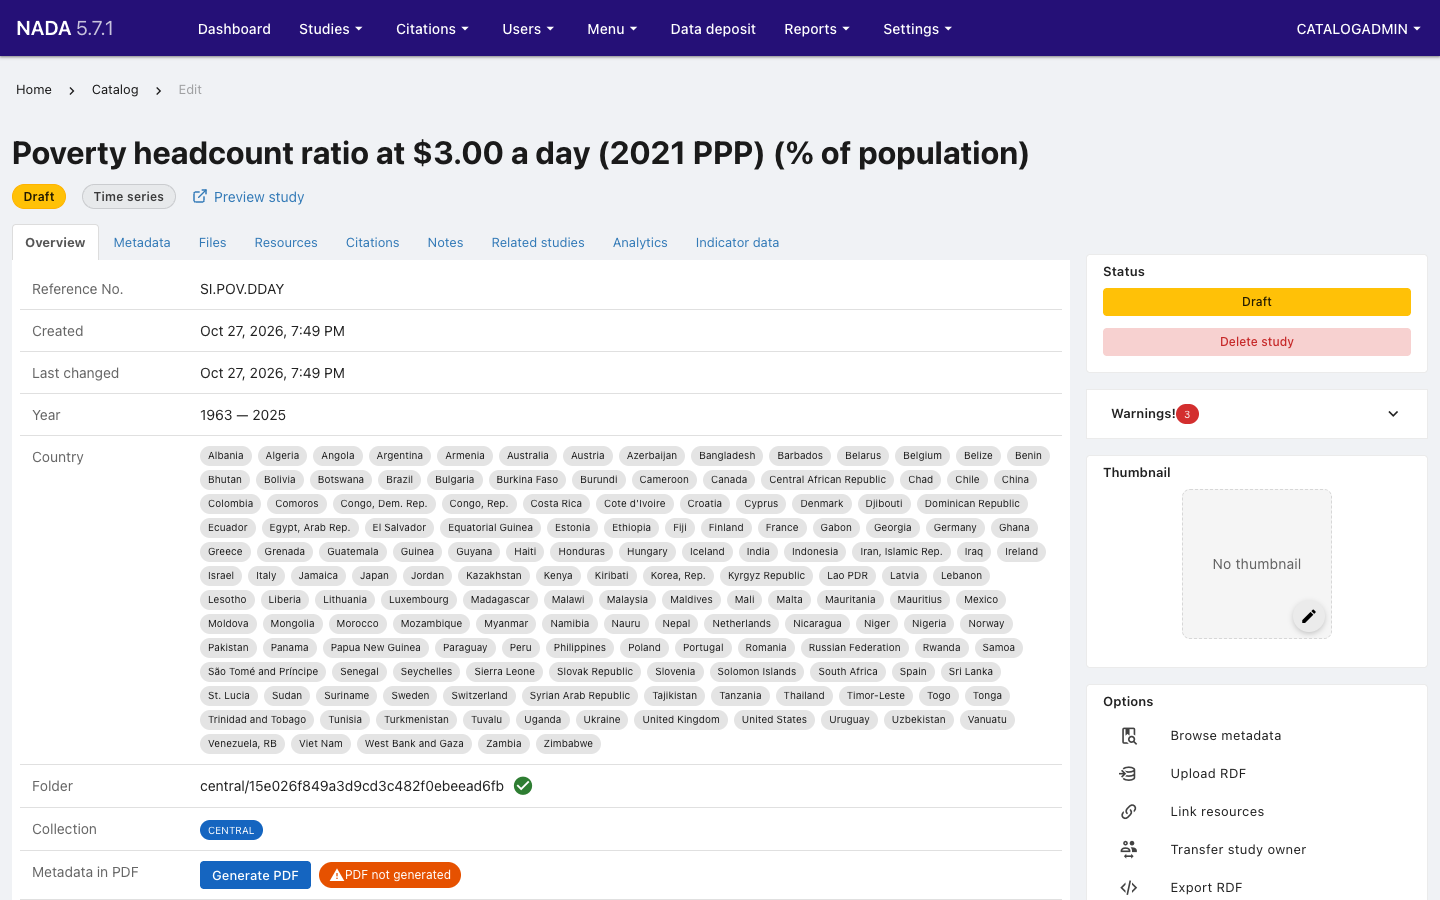
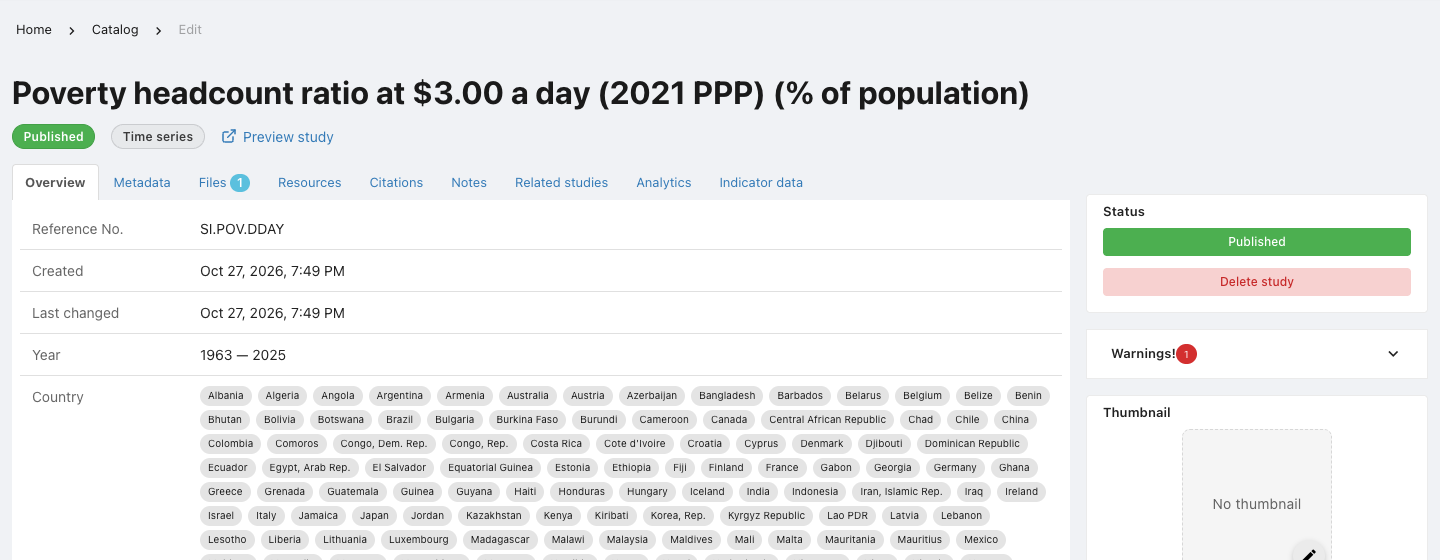
NADA recognizes the file as a time series, creates the indicator, and opens it. The Overview shows the title, the Reference No. SI.POV.DDAY, the years 1963–2025 and the 183 countries. The indicator is a Draft: it is not visible in the catalog yet.
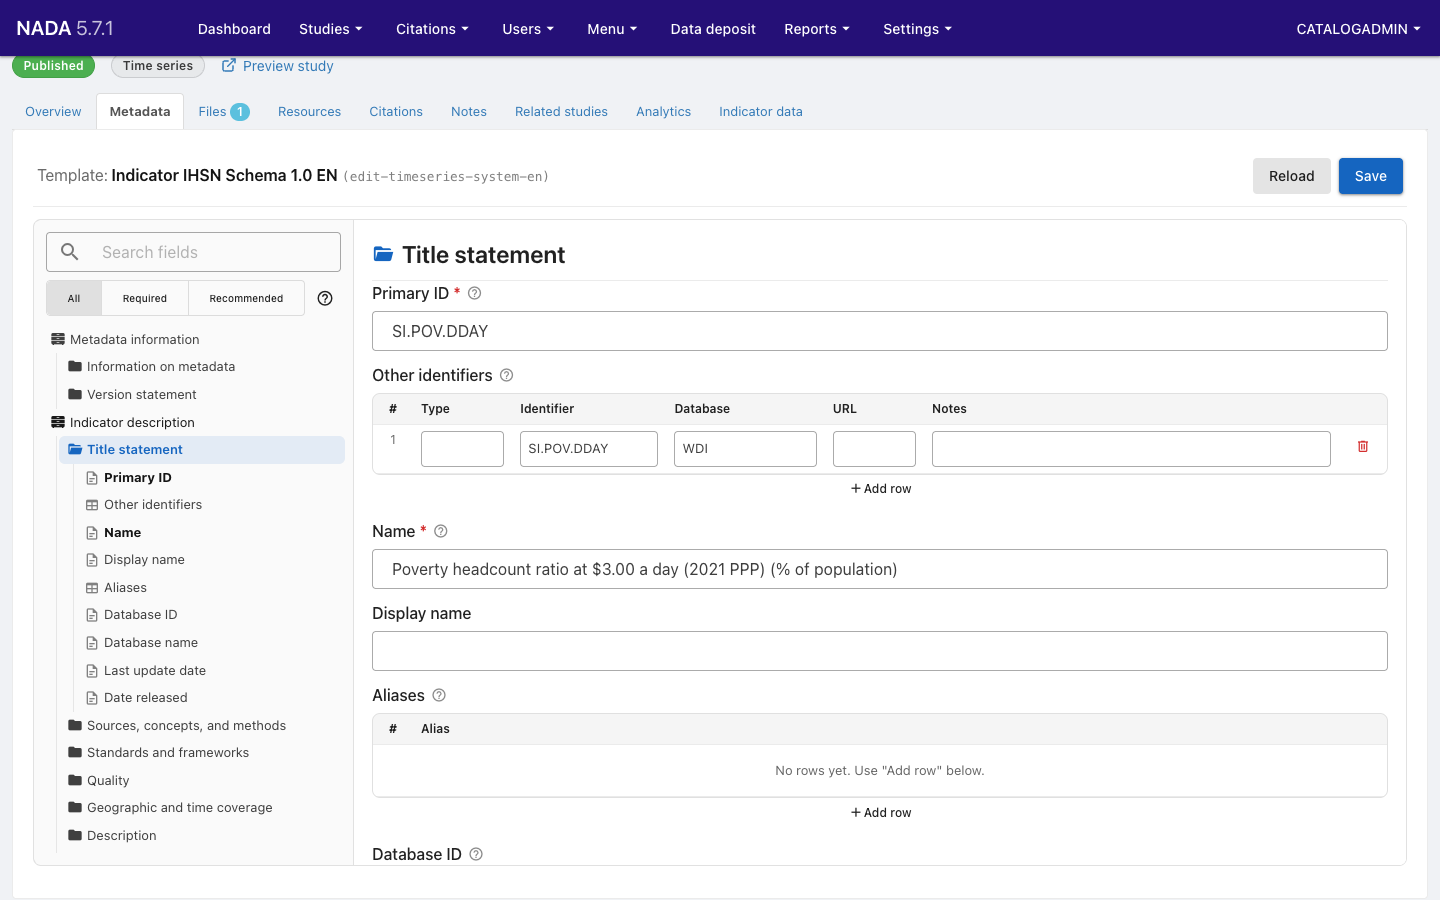
Check: open the Metadata tab, then Indicator description → Title statement. Primary ID is SI.POV.DDAY and Name is the indicator's name. The other sections hold the definitions, methodology, sources and coverage from the file.
Step 3: Upload the data
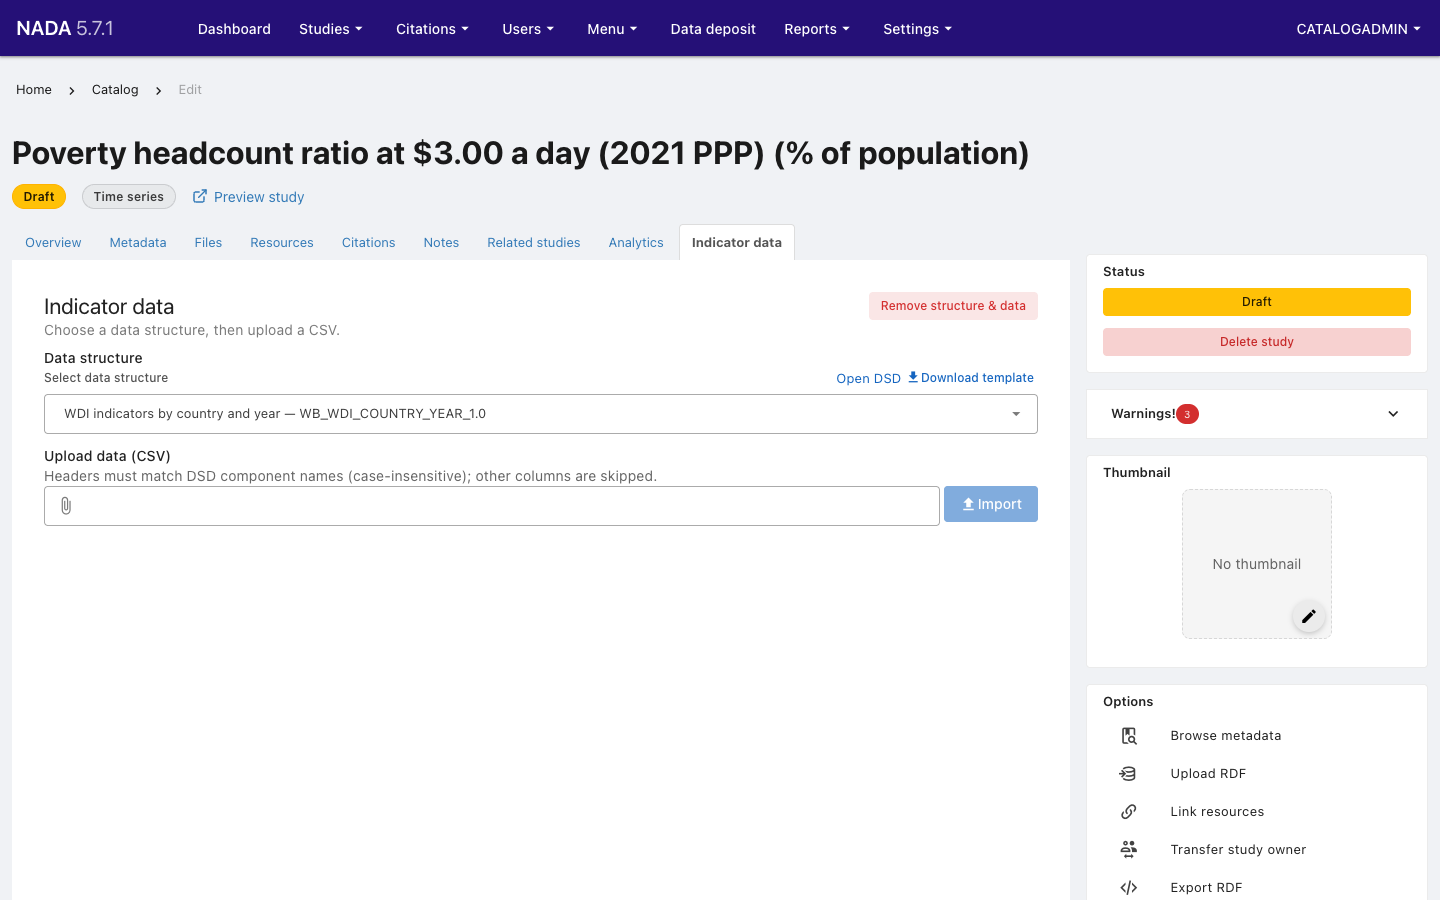
Open the Indicator data tab.
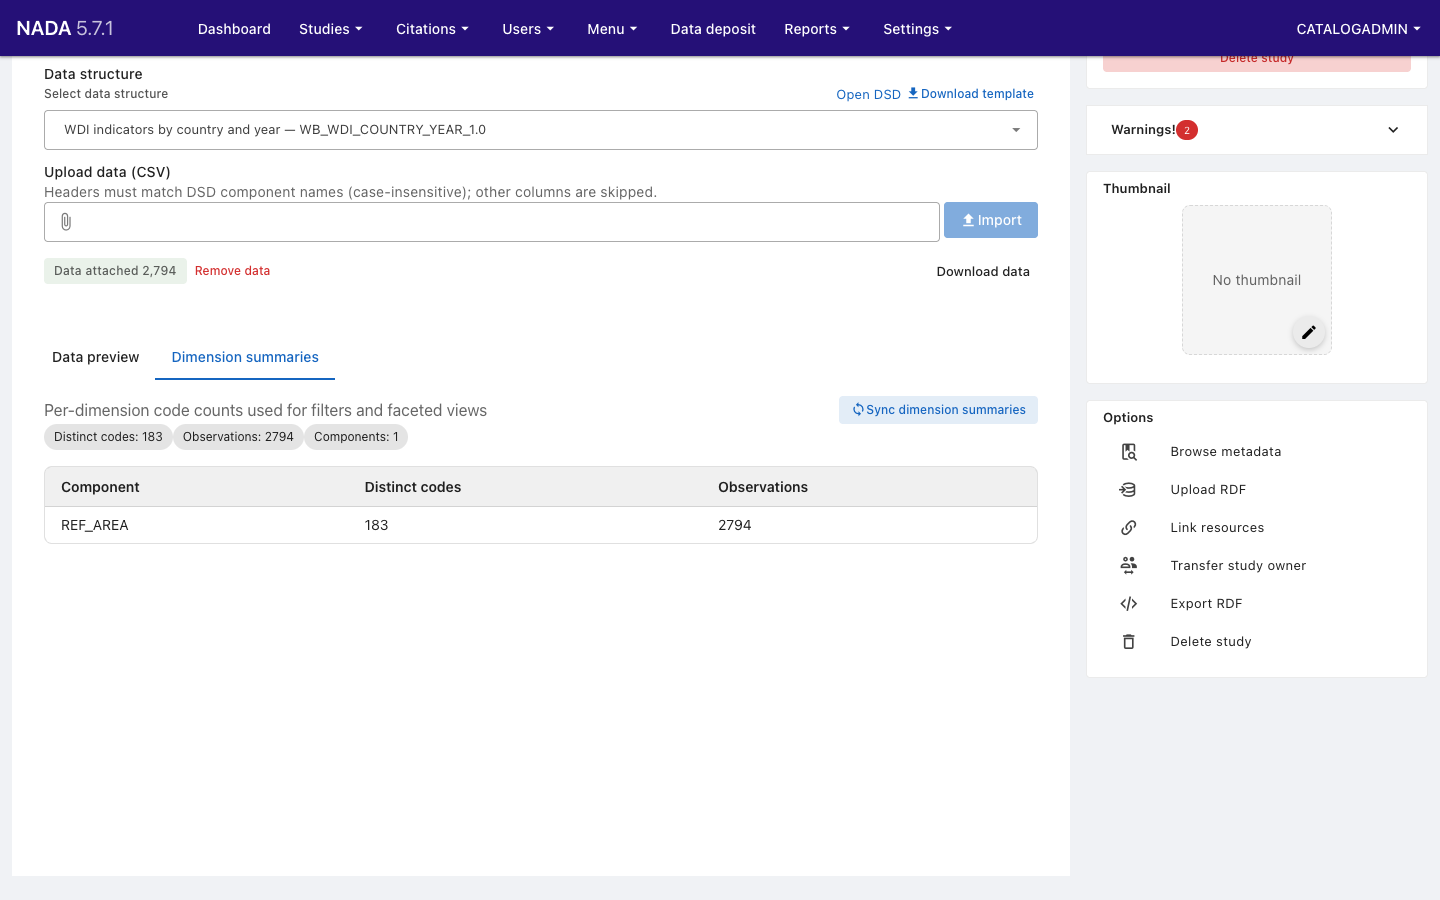
The Data structure field already shows WDI indicators by country and year — WB_WDI_COUNTRY_YEAR_1.0: the metadata file linked it.
Under Upload data (CSV), choose
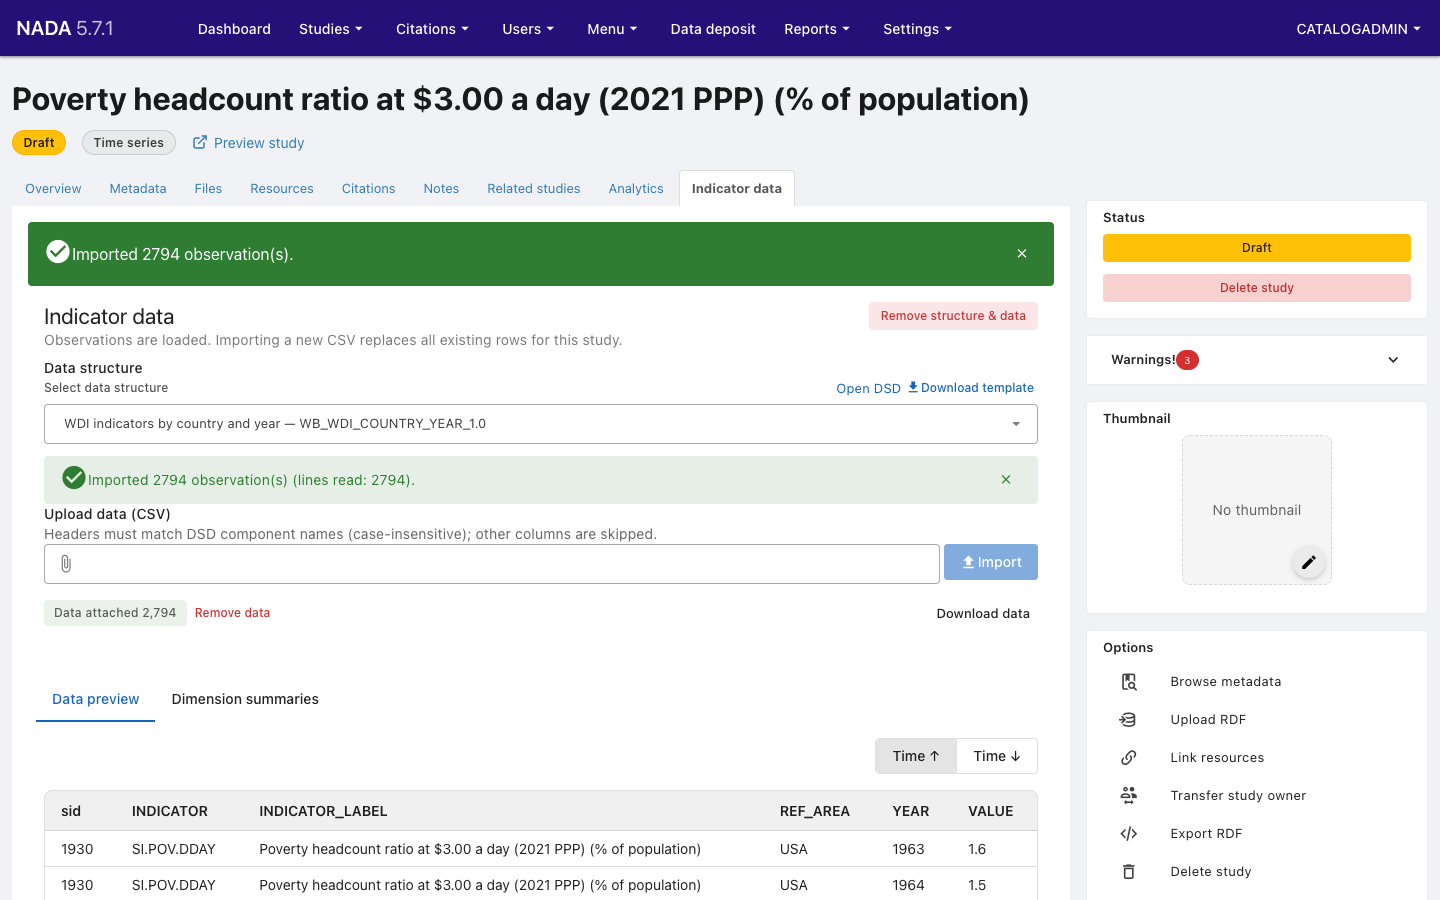
SI.POV.DDAY_data.csvand click Import.
NADA shows Imported 2794 observation(s) and Data attached 2,794. The Data preview below lists the rows.
Check: open Dimension summaries. REF_AREA has 183 distinct codes and 2794 observations. These counts drive the country filter in the catalog.
Step 4: Add a thumbnail and publish
- Open the Overview tab. In the Thumbnail panel, click the pencil, choose
SI.POV.DDAY_thumbnail.jpgand click Upload. - In the Status panel, click Draft. It changes to Published.
Step 5: Explore the indicator in the catalog
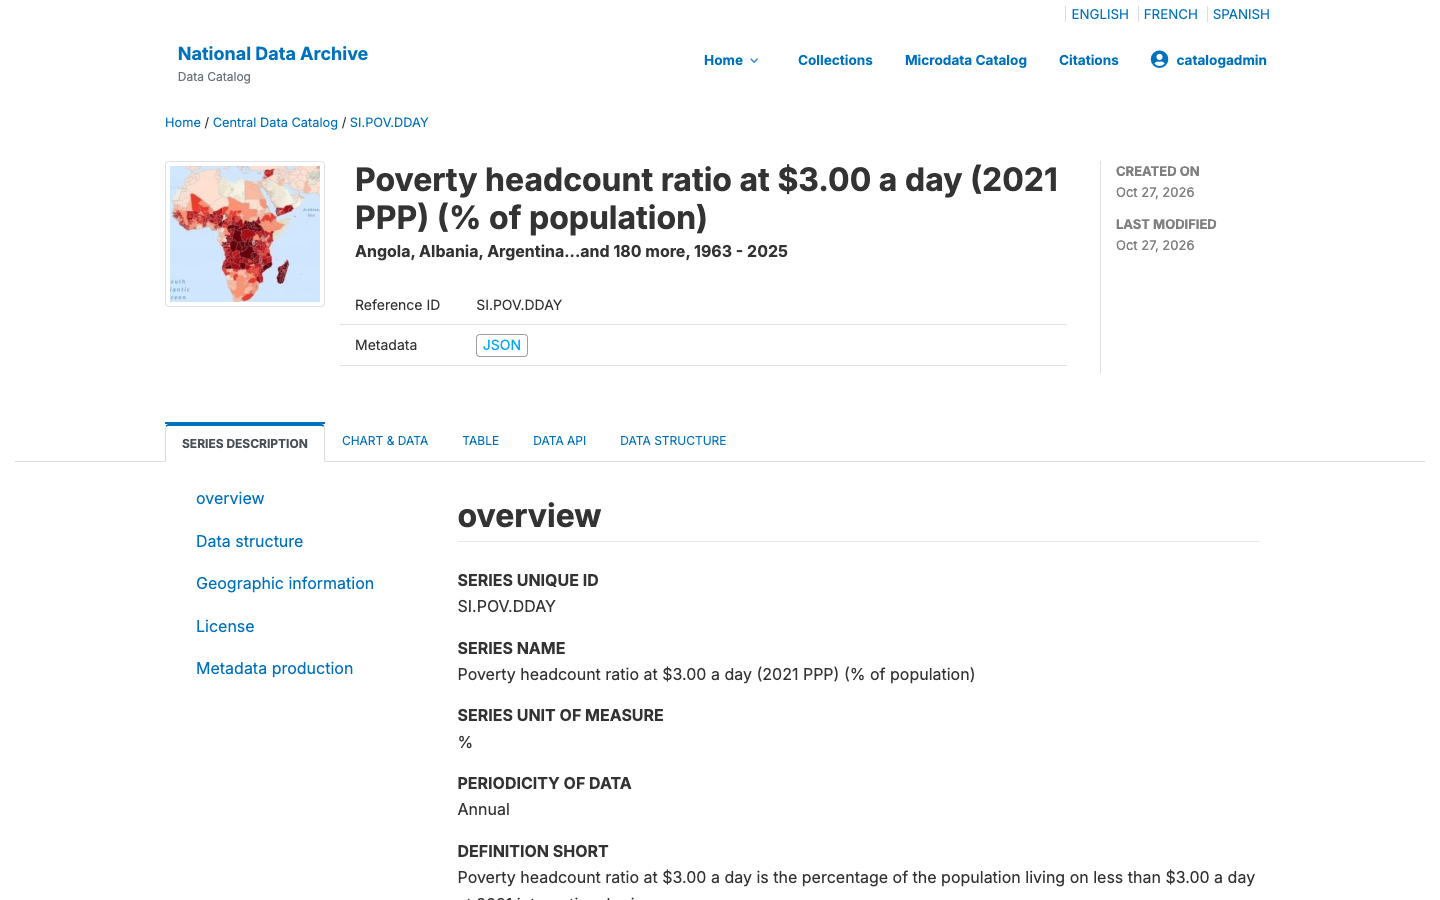
Click Preview study under the title to open the indicator's catalog page. The header shows the thumbnail, the title, Angola, Albania, Argentina...and 180 more, 1963 - 2025, and the reference ID.
The page has five tabs:
Series description: the metadata.
Chart & data: an interactive chart. On the left, the Year slider and the Country list filter the data; the first country, Angola, is selected at first.
- Clear Angola, and select Albania and Argentina. The chart updates as you select.
- Click Line.
Argentina has a value for most years. Albania's values are separate points (1996, 2002, 2005…) because poverty is measured only in the years a household survey was run. Chart data below the chart lists the 47 values shown.
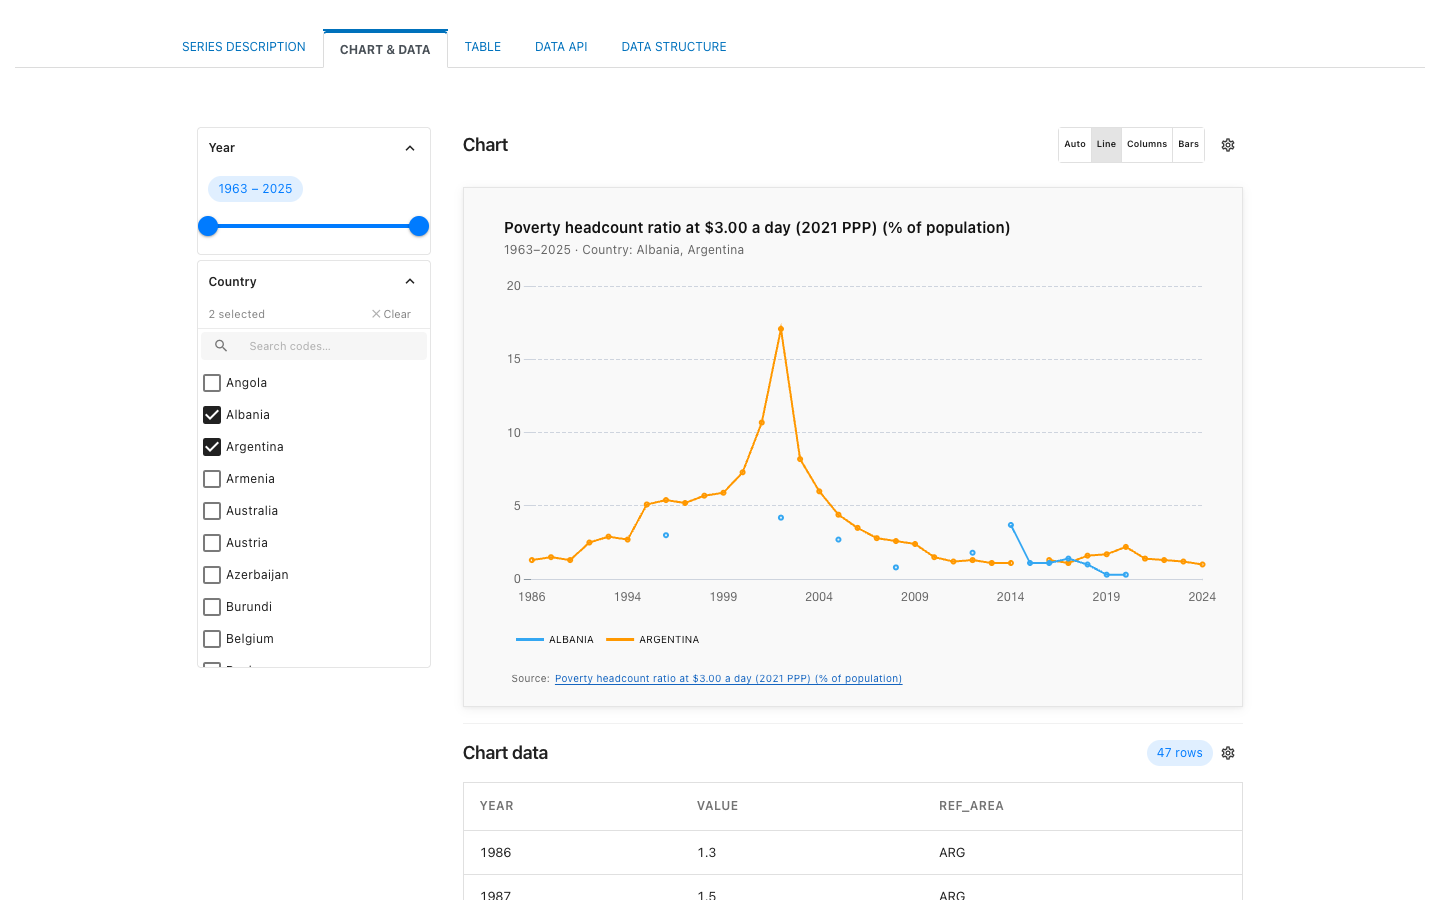
Table: the same data as a table, with countries as rows and years as columns. Use Filters and Layout to change it. The countries you selected on Chart & data are kept when you switch tabs.
Data API: how to get the data with the API, and a Data explorer with all 2,794 observations.
Data structure: the five columns and their roles. Expand
REF_AREAto see its 183 codes. Download JSON and Download SDMX/XML download the data structure.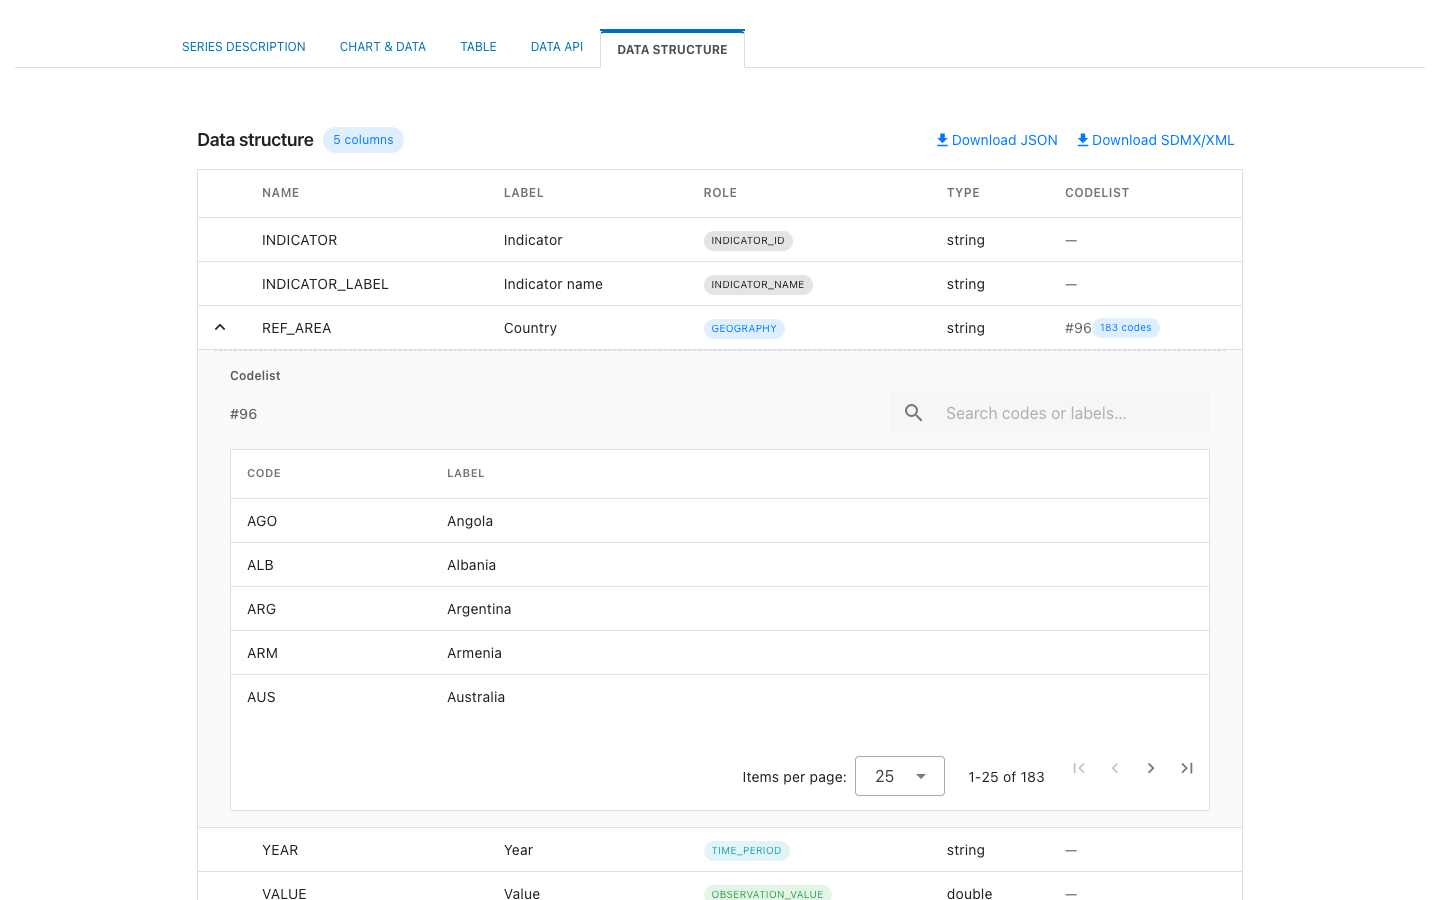
Step 6: See how uploads work
An upload always replaces all of an indicator's data.
- In the admin, on the Indicator data tab, choose
SI.POV.DDAY_data-6-countries.csvand click Import. - NADA asks: This import will replace all existing indicator observations for this study with the rows in your CSV. Continue? Click OK.
Check: the tab shows Data attached 91. In the catalog, Chart & data now has 6 countries, and the Year range is 1981–2024.
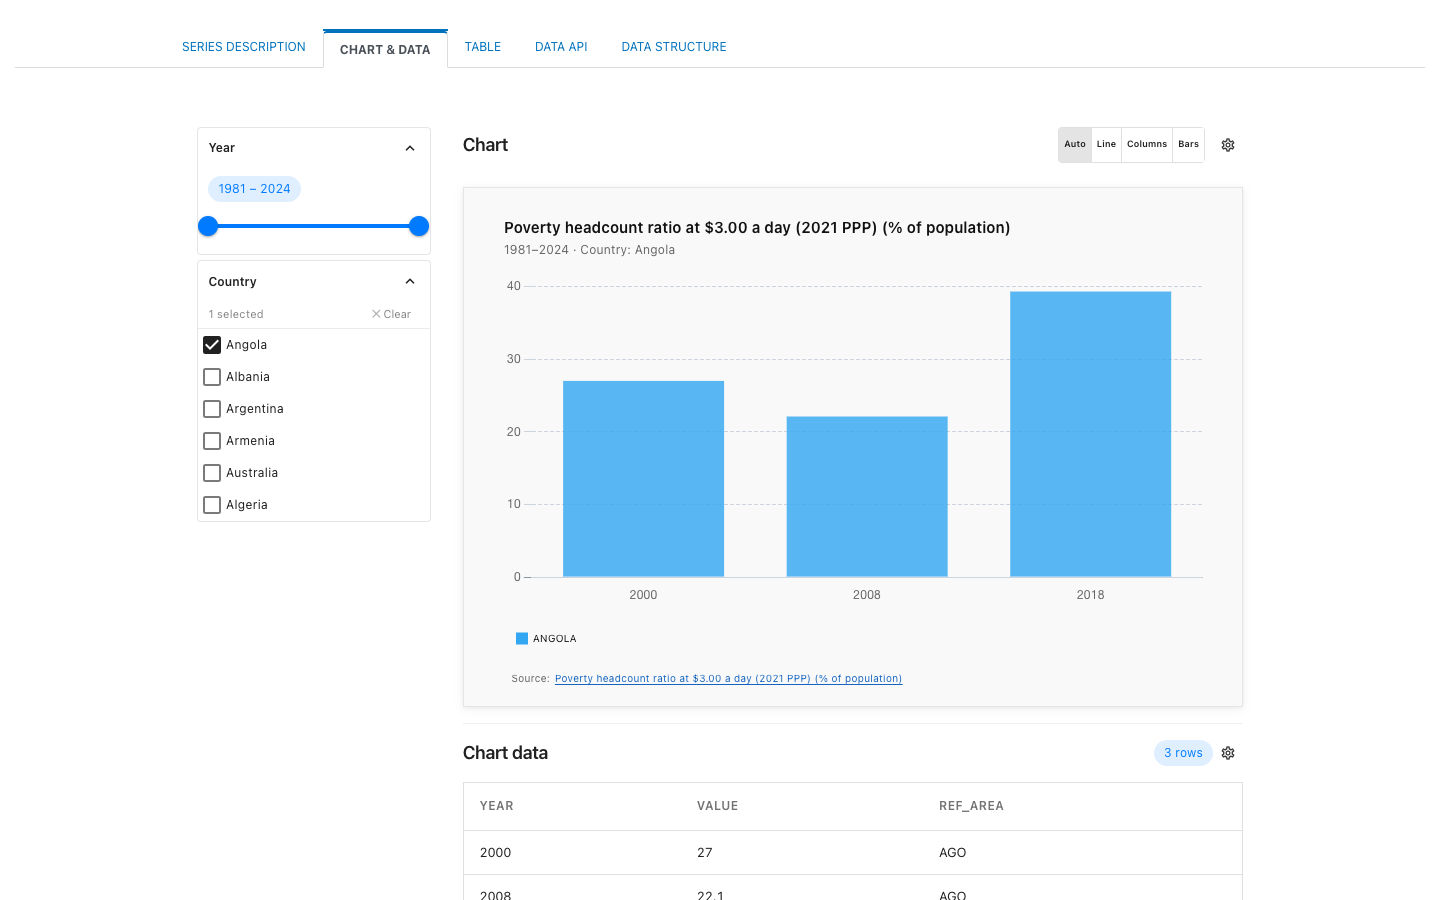
Upload SI.POV.DDAY_data.csv again to restore all 2,794 rows.
What you did
| You created | Where | Shared? |
|---|---|---|
Data structure WB_WDI_COUNTRY_YEAR_1.0 | Settings → Data structures | Yes: any annual, country-level indicator can use it |
Codelist WB_CL_REF_AREA_1.0 | Settings → Codelists | Yes |
Indicator SI.POV.DDAY, with its metadata, data and thumbnail | Studies → Manage studies | No |
To publish another WDI indicator, repeat steps 2 to 5 with its own metadata and data files, and reuse the same data structure.
Clean up
To remove the tutorial content:
- Delete the indicator: open it and click Delete study in the Status panel.
- Delete the data structure in Settings → Data structures, and the codelist in Settings → Codelists, if no other indicator uses them.
Next steps
- Create an indicator in NADA: the same workflow in detail, including creating an indicator without a metadata file
- Choose a workflow: publish from the Metadata Editor or with the API instead
- Catalog frontend: everything users see on an indicator page