Indicators — Admin UI (codelists, DSDs, projects)
This page covers the administrator screens for codelists, data structure definitions (DSDs), and indicator projects.
Also see:
- Publishing indicators — metadata schemas and API examples
- Catalog frontend — what users see on a published series page
Indicators are summary measures derived from observed facts. When repeated over time at a regular frequency, they form a time series. NADA supports publishing indicators with rich metadata, interactive charts, data downloads, and API access.
The workflow for publishing indicators involves three building blocks — Codelists, Data Structure Definitions (DSDs), and Indicator projects — before users can explore the data on the frontend.
Codelists
A codelist is a controlled vocabulary — a named list of codes and their labels — used to classify indicator data. For example, a codelist might define the set of valid country codes, or a list of indicator categories. Codelists are referenced by DSDs to define the allowed values for dimension columns.
Viewing codelists
Navigate to Settings → Codelists in the admin menu to see all available codelists.
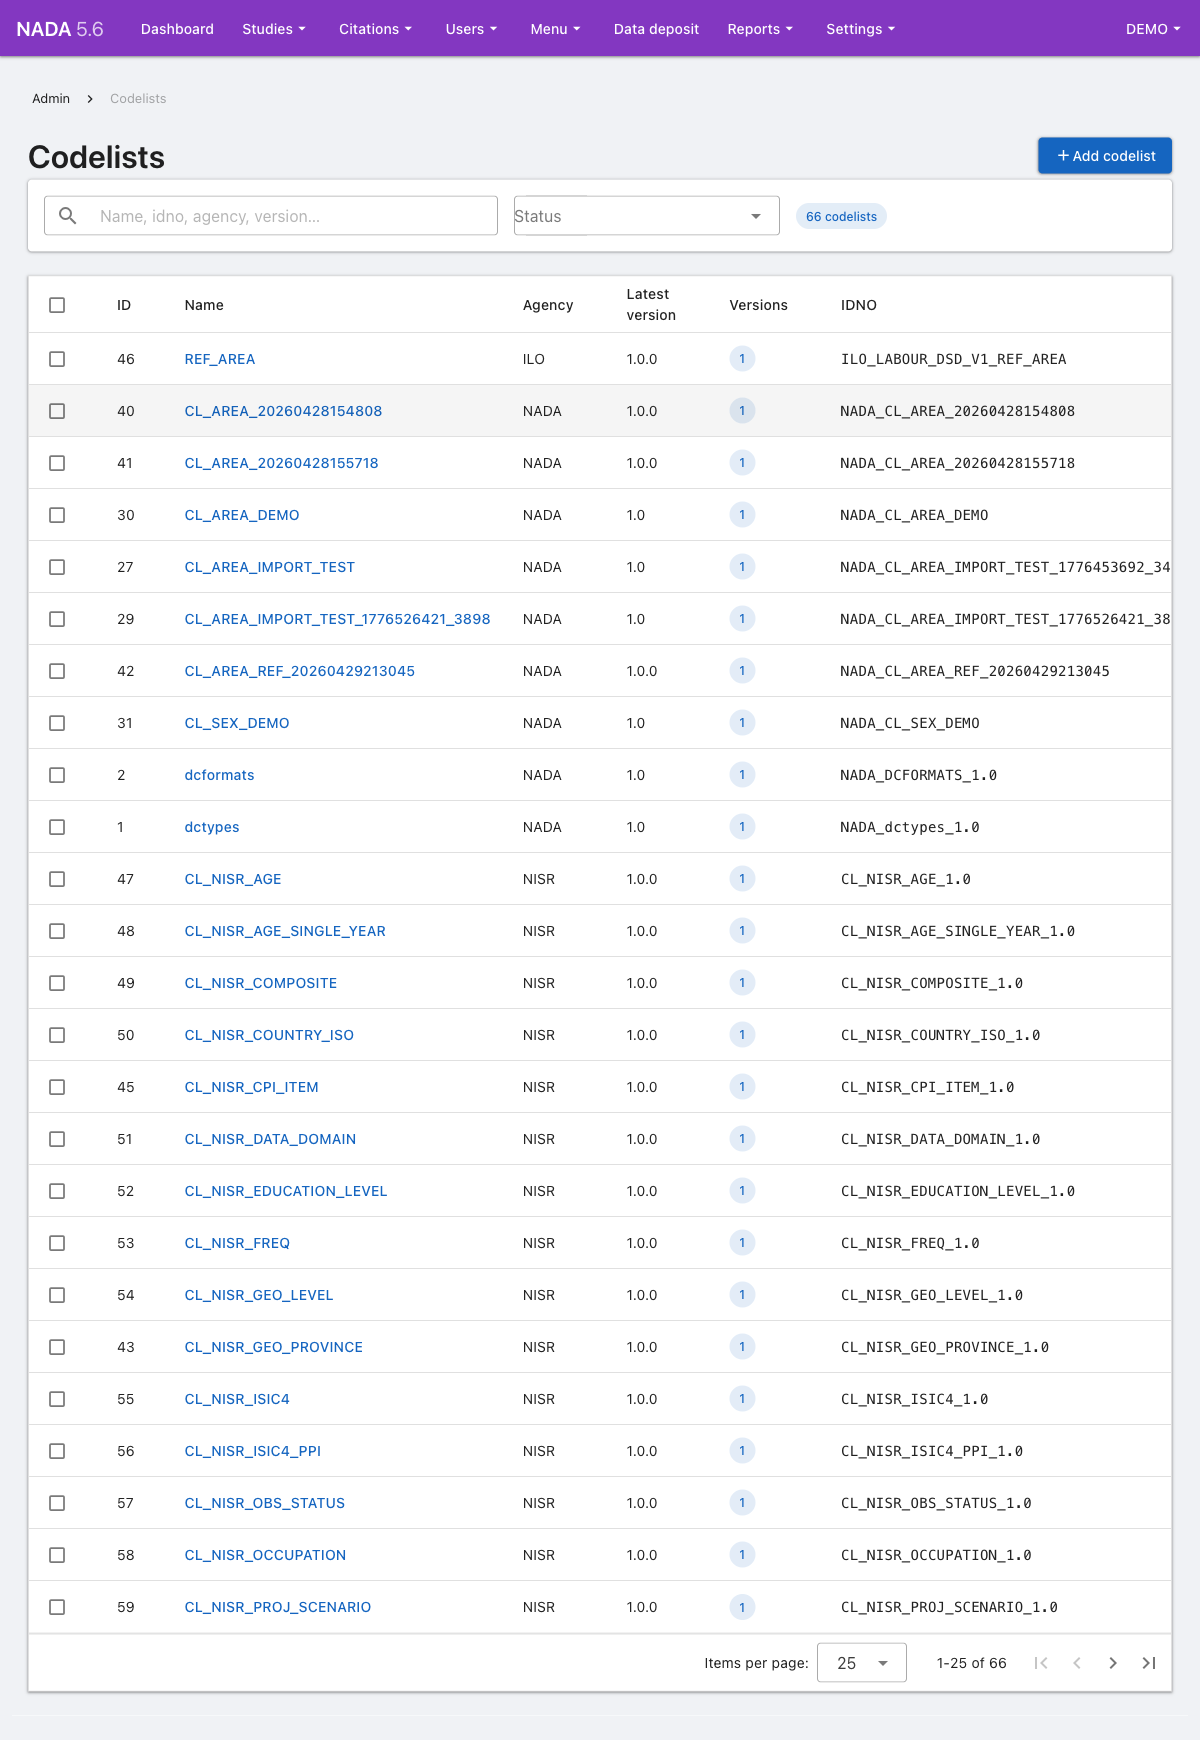
The list shows the codelist ID, Name, Agency, latest version, and IDNO. Use the search bar or Status filter to narrow results. Click Add codelist to create a new one.
Codelist details
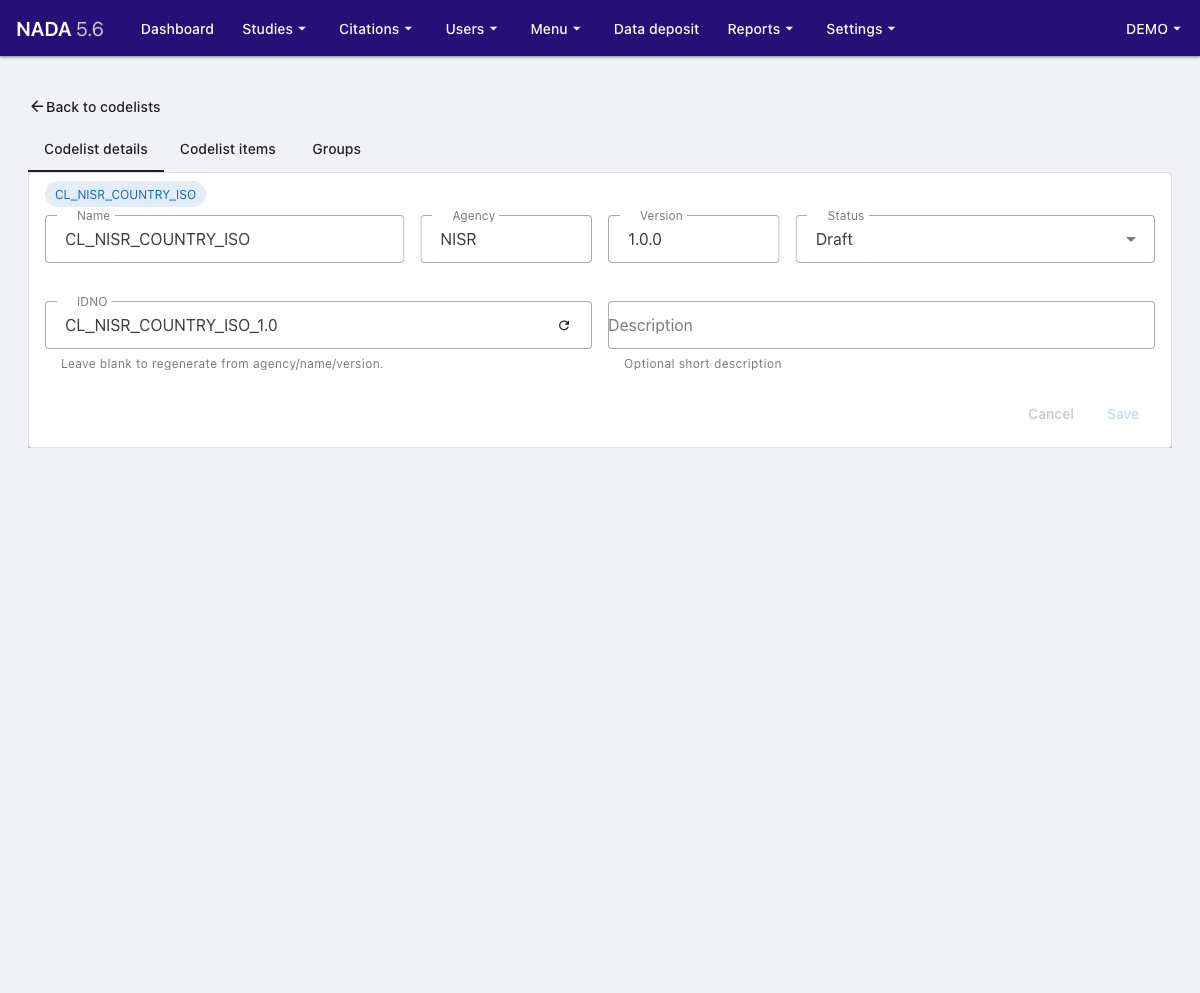
Click on any codelist name to open it. The Codelist details tab contains the identity fields: Name, Agency, Version, Status, and an auto-generated IDNO.
Codelist items
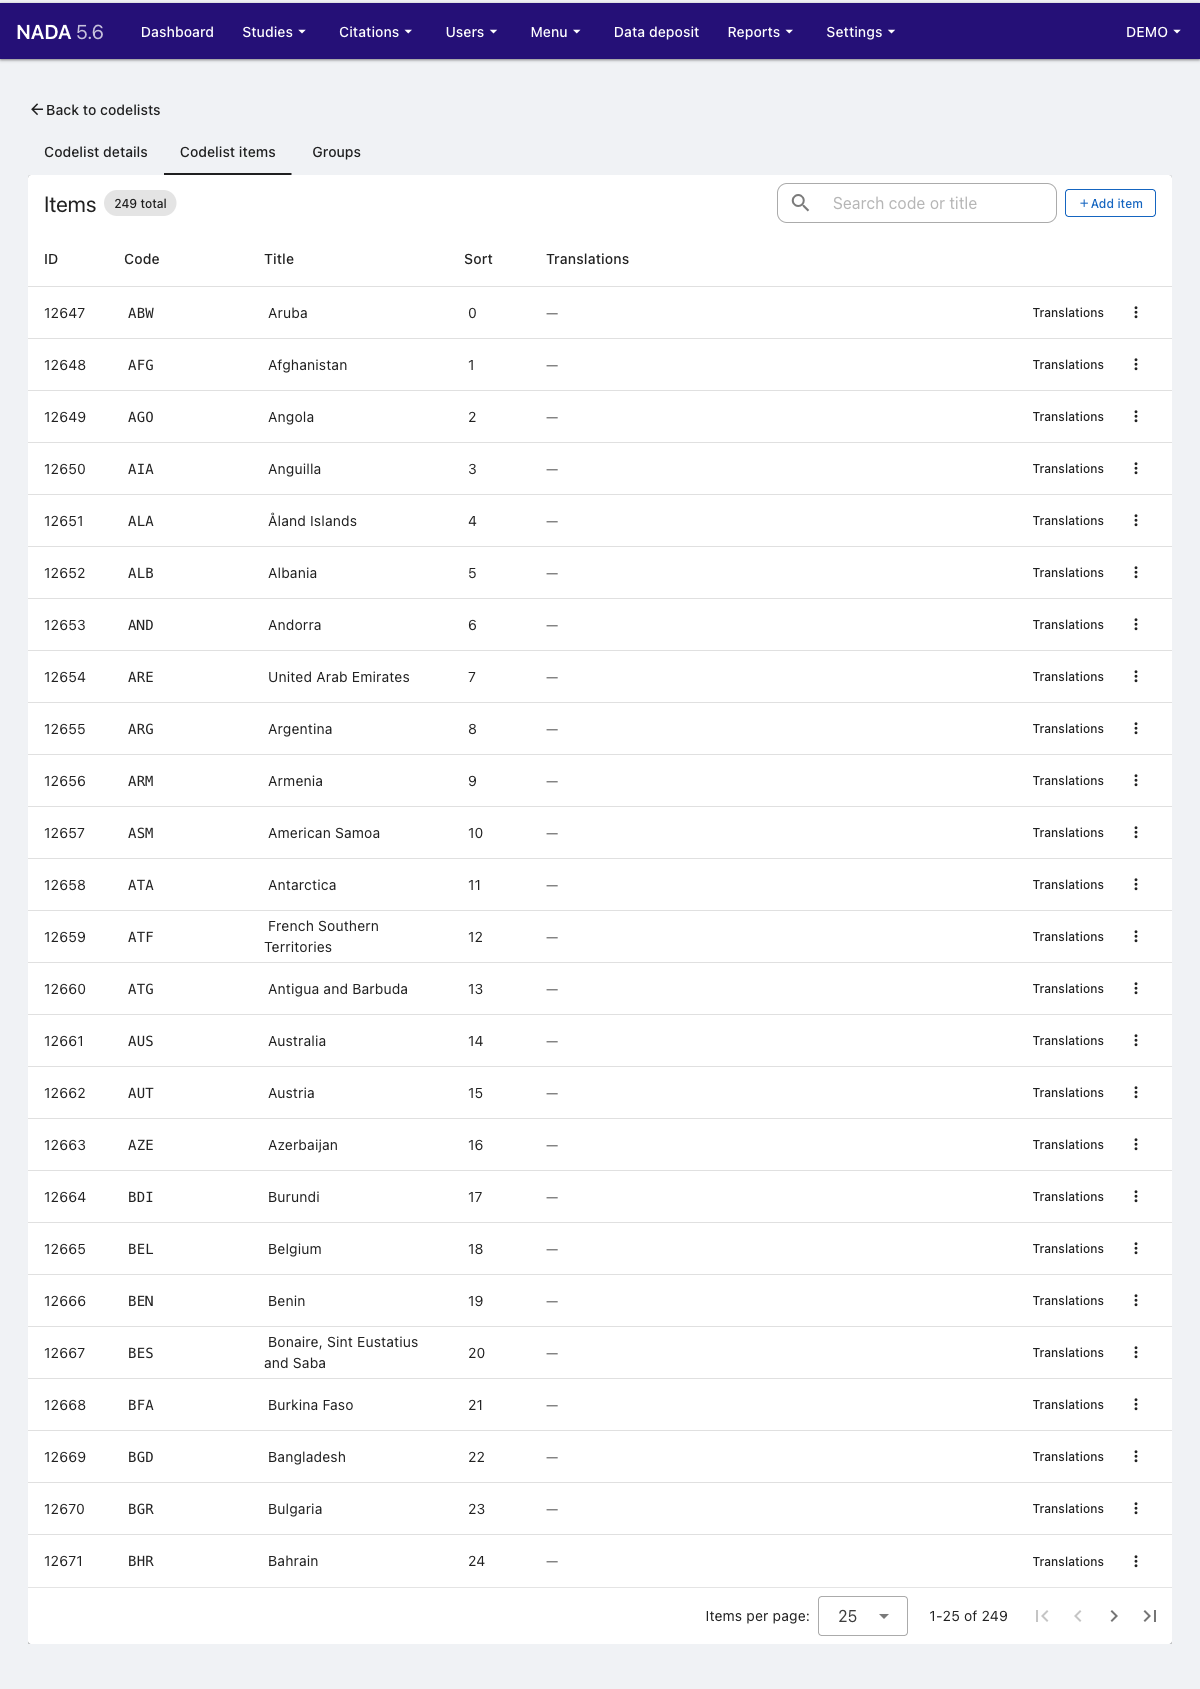
Click the Codelist items tab to view and manage the individual codes. Each item has a Code, Title, Sort order, and optional Translations. Use + Add item to add codes manually, or use the search box to filter existing ones.
Data Structure Definitions (DSDs)
A Data Structure Definition describes the structure of a dataset — which columns exist, what role each plays (dimension, attribute, observation value), and which codelist (if any) constrains the allowed values. DSDs are created once and reused across indicator projects.
Viewing DSDs
Navigate to Settings → Data structures to see all available DSDs.
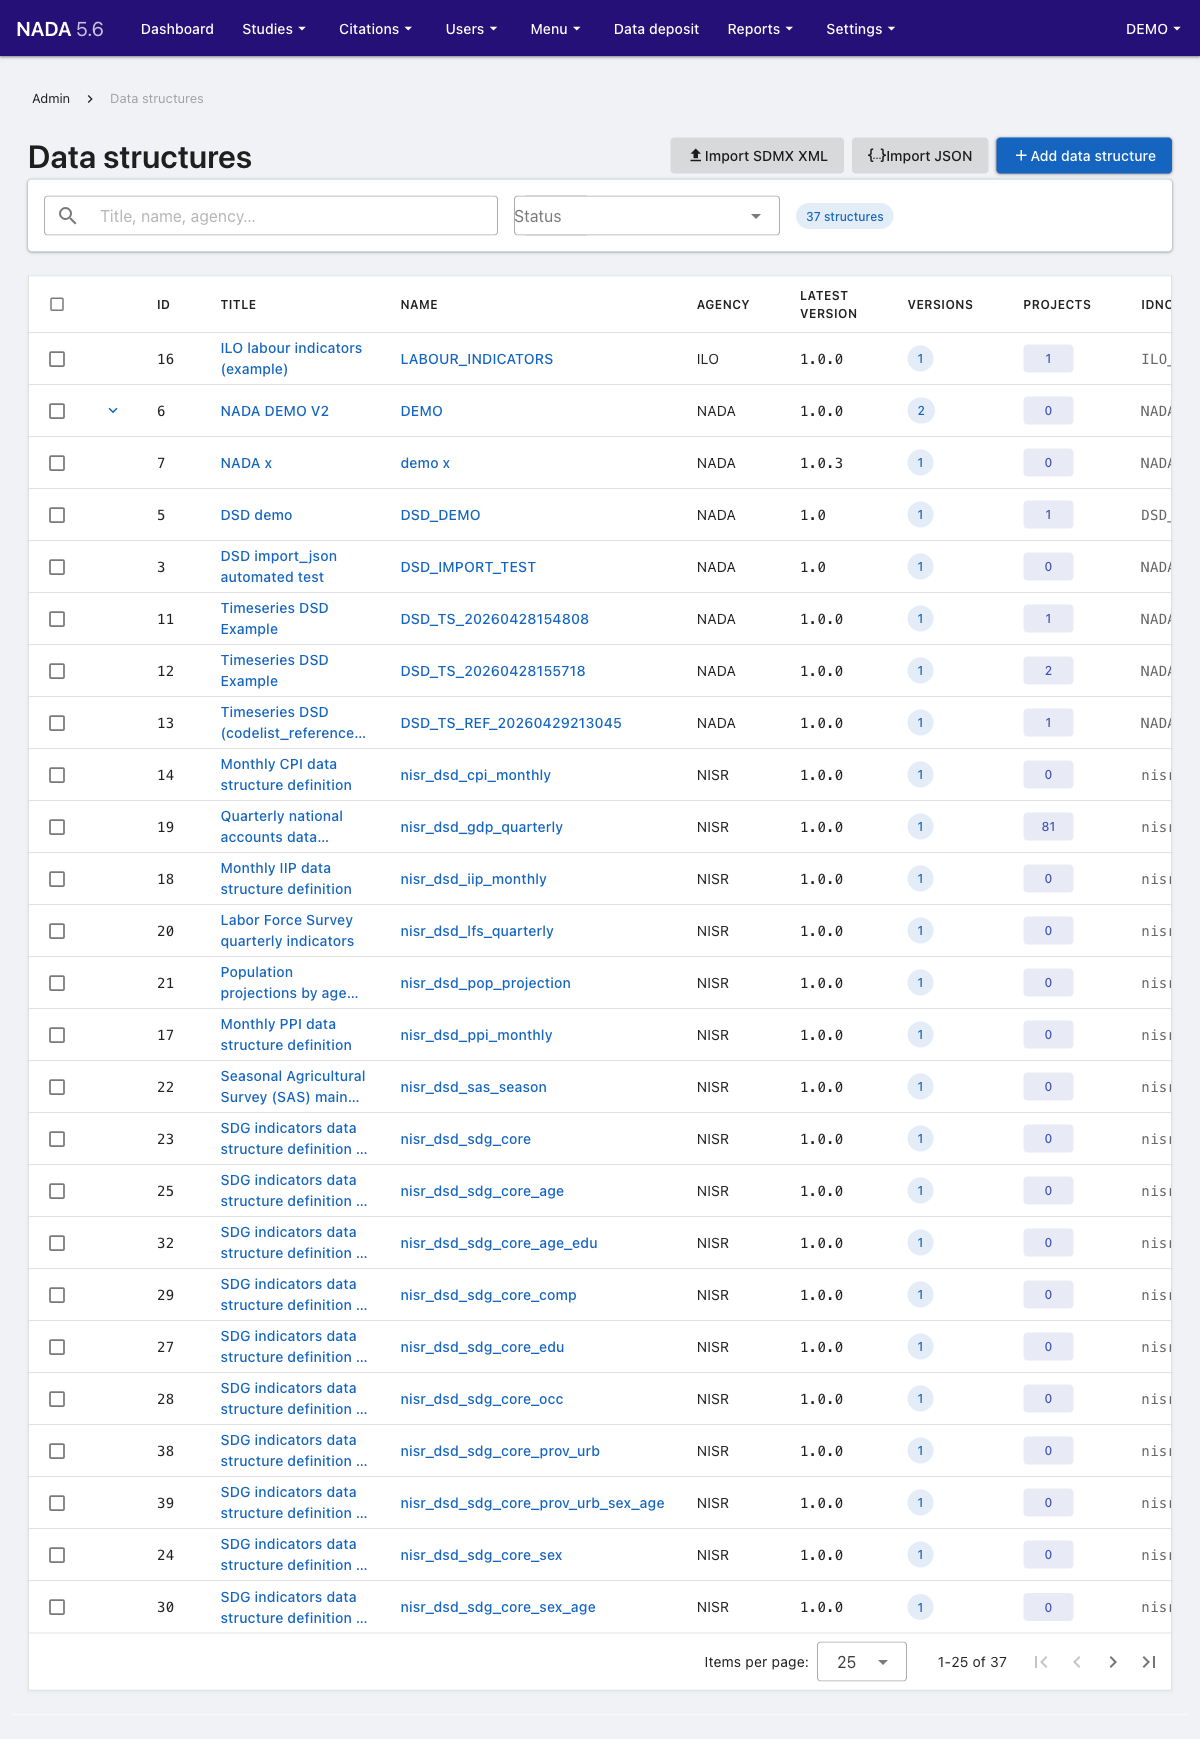
The list shows the Title, Name, Agency, version history, and the number of projects using each DSD. You can import DSDs from SDMX XML or JSON format, or create one manually using Add data structure.
DSD detail
Click on a DSD to open it. The left sidebar lists all Components (columns). The right panel shows the identity fields: Name, Agency, Version, IDNO, Title, Status, Description, and Notes.
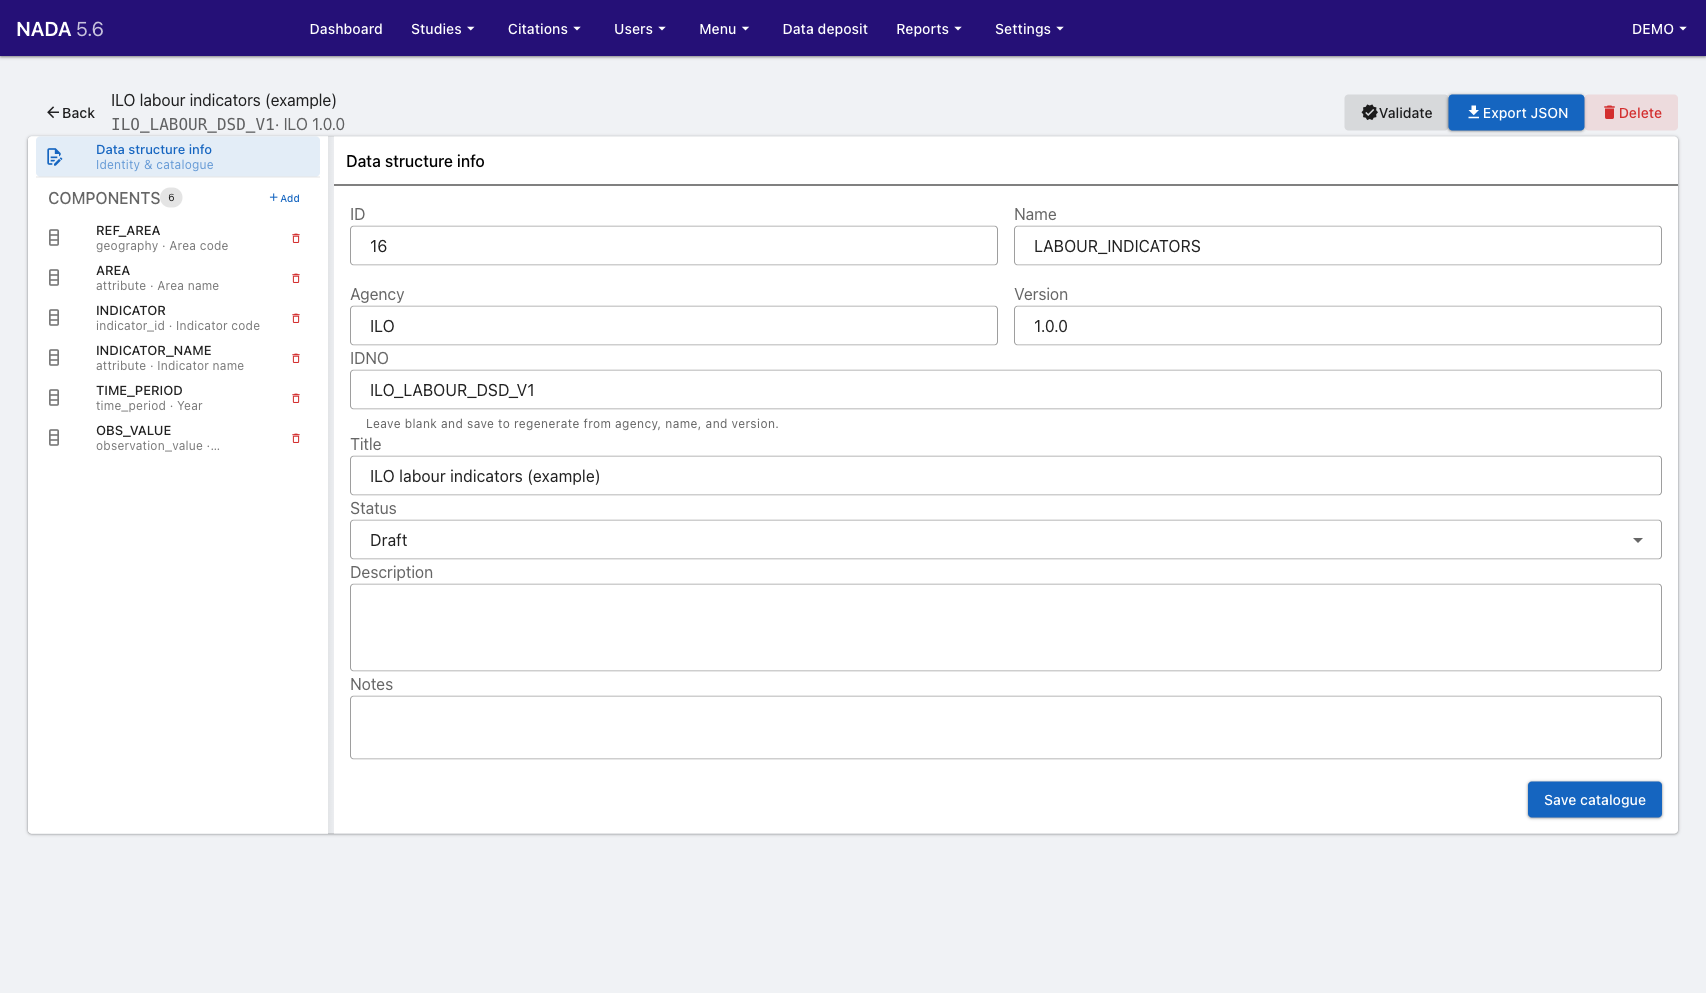
Click Validate to check the DSD is structurally correct. Use Export JSON to download the DSD definition.
DSD components
Click any component in the left sidebar to view and edit its properties: Name, Label, Column type (e.g. geography, time_period, observation_value), Data type, and the linked Codelist. The codelist codes are previewed inline.
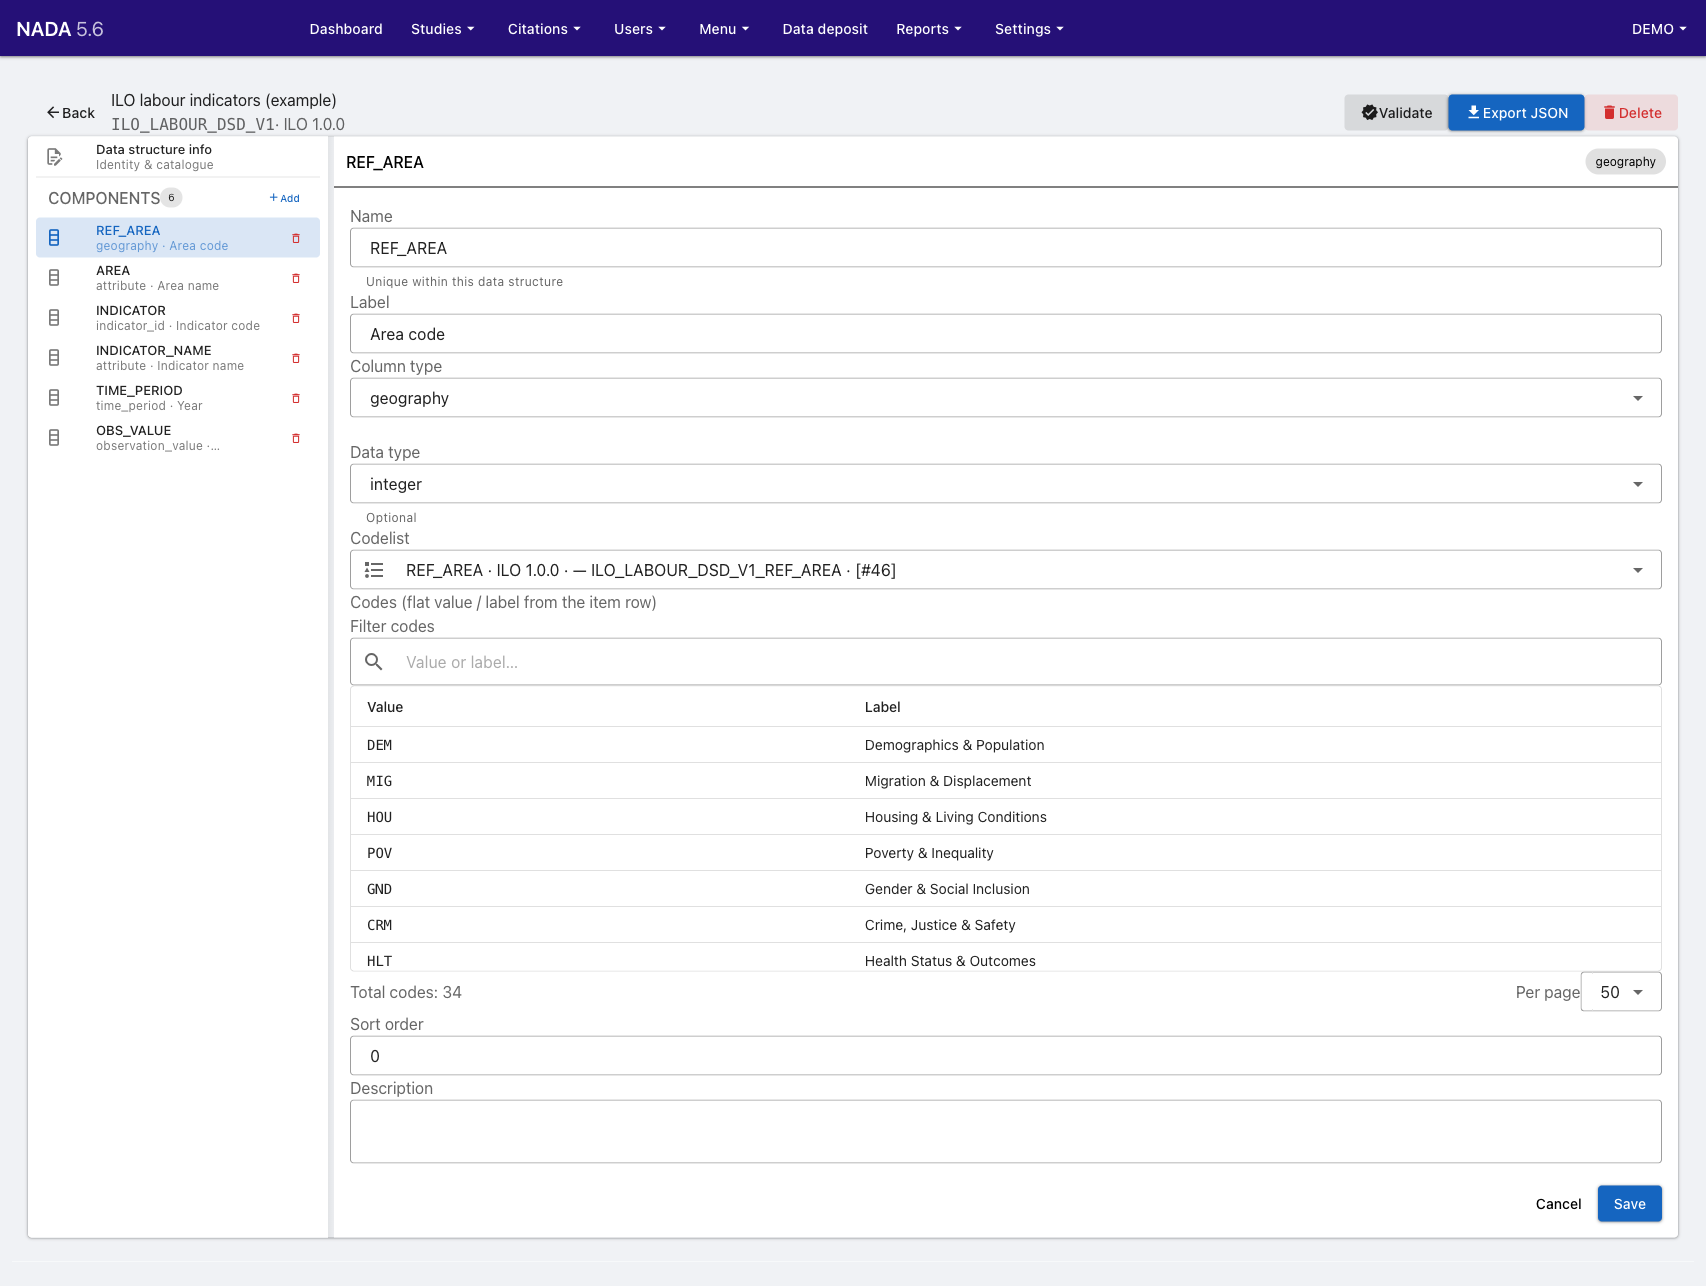
Use + Add in the components panel to add a new column to the DSD.
Creating an indicator project
An indicator project (Time series entry) ties together the metadata, data structure, and uploaded data for a single indicator series.
Overview tab
Navigate to Catalog in the admin menu and open an existing time series entry, or create a new one via Add study → Time series. The Overview tab shows the key settings: IDNO, title, date range, countries covered, data access policy, and the linked indicator database.
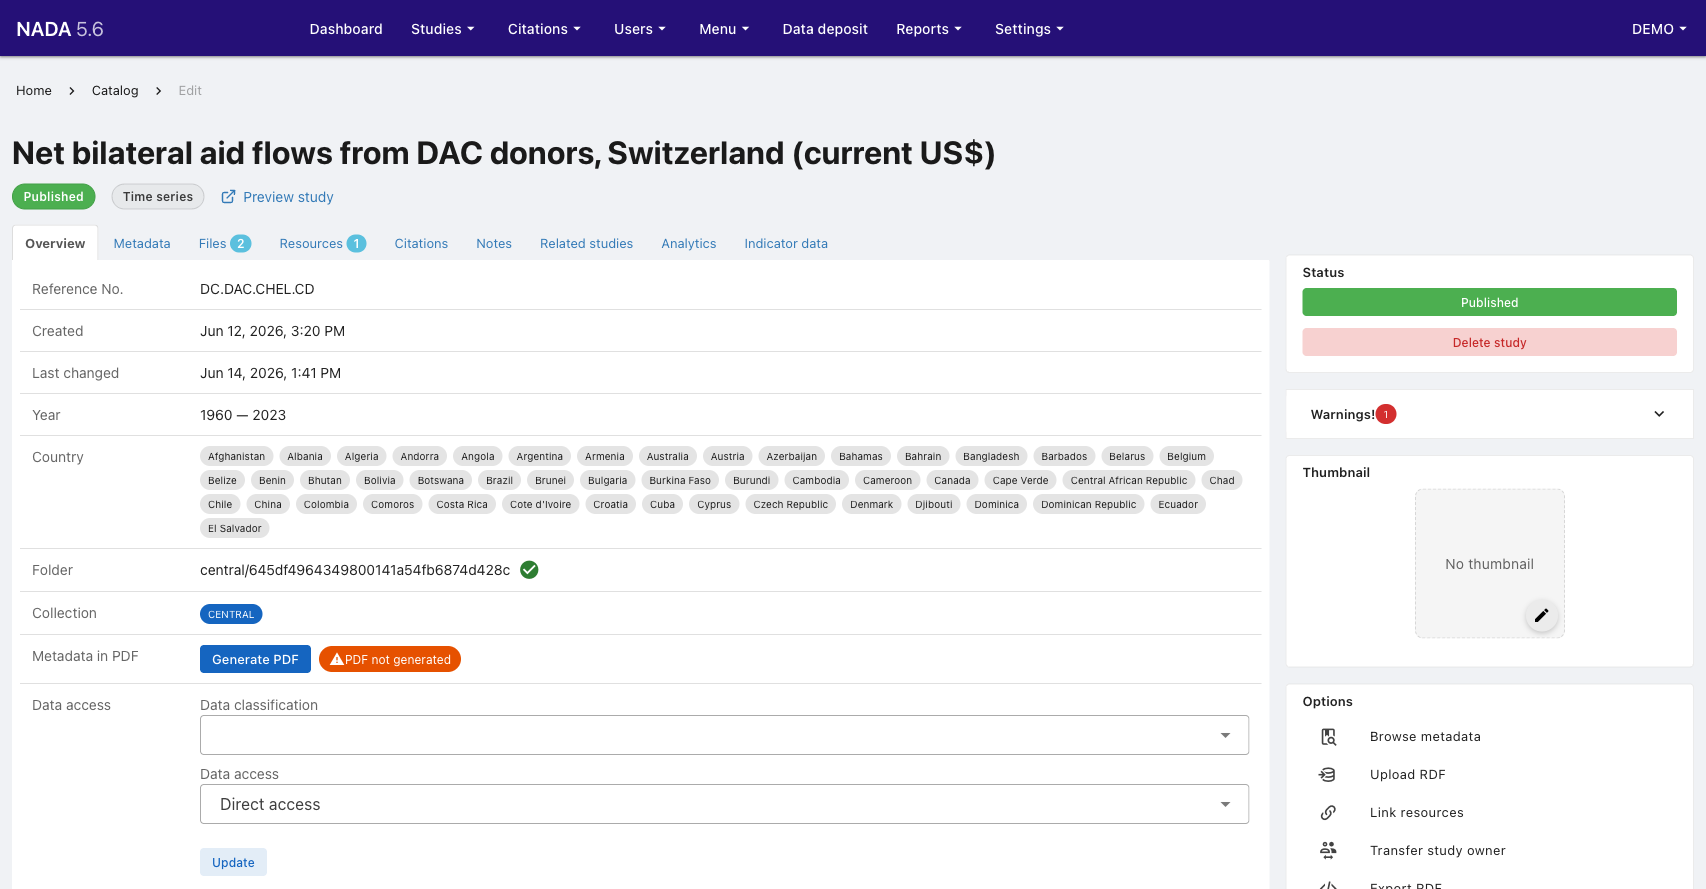
Set the Status to Published using the button in the right panel when ready to make the entry visible in the catalog.
Metadata tab
The Metadata tab contains the full timeseries schema, organized into collapsible sections:
- Series Description — IDNO, series name, database link, aliases, alternate identifiers, measurement unit, periodicity, base period, definitions, methodology, sources, topics, geographic units, and more.
- Metadata creation — provenance of the metadata record itself.
- Tags — free-text tags for discoverability.
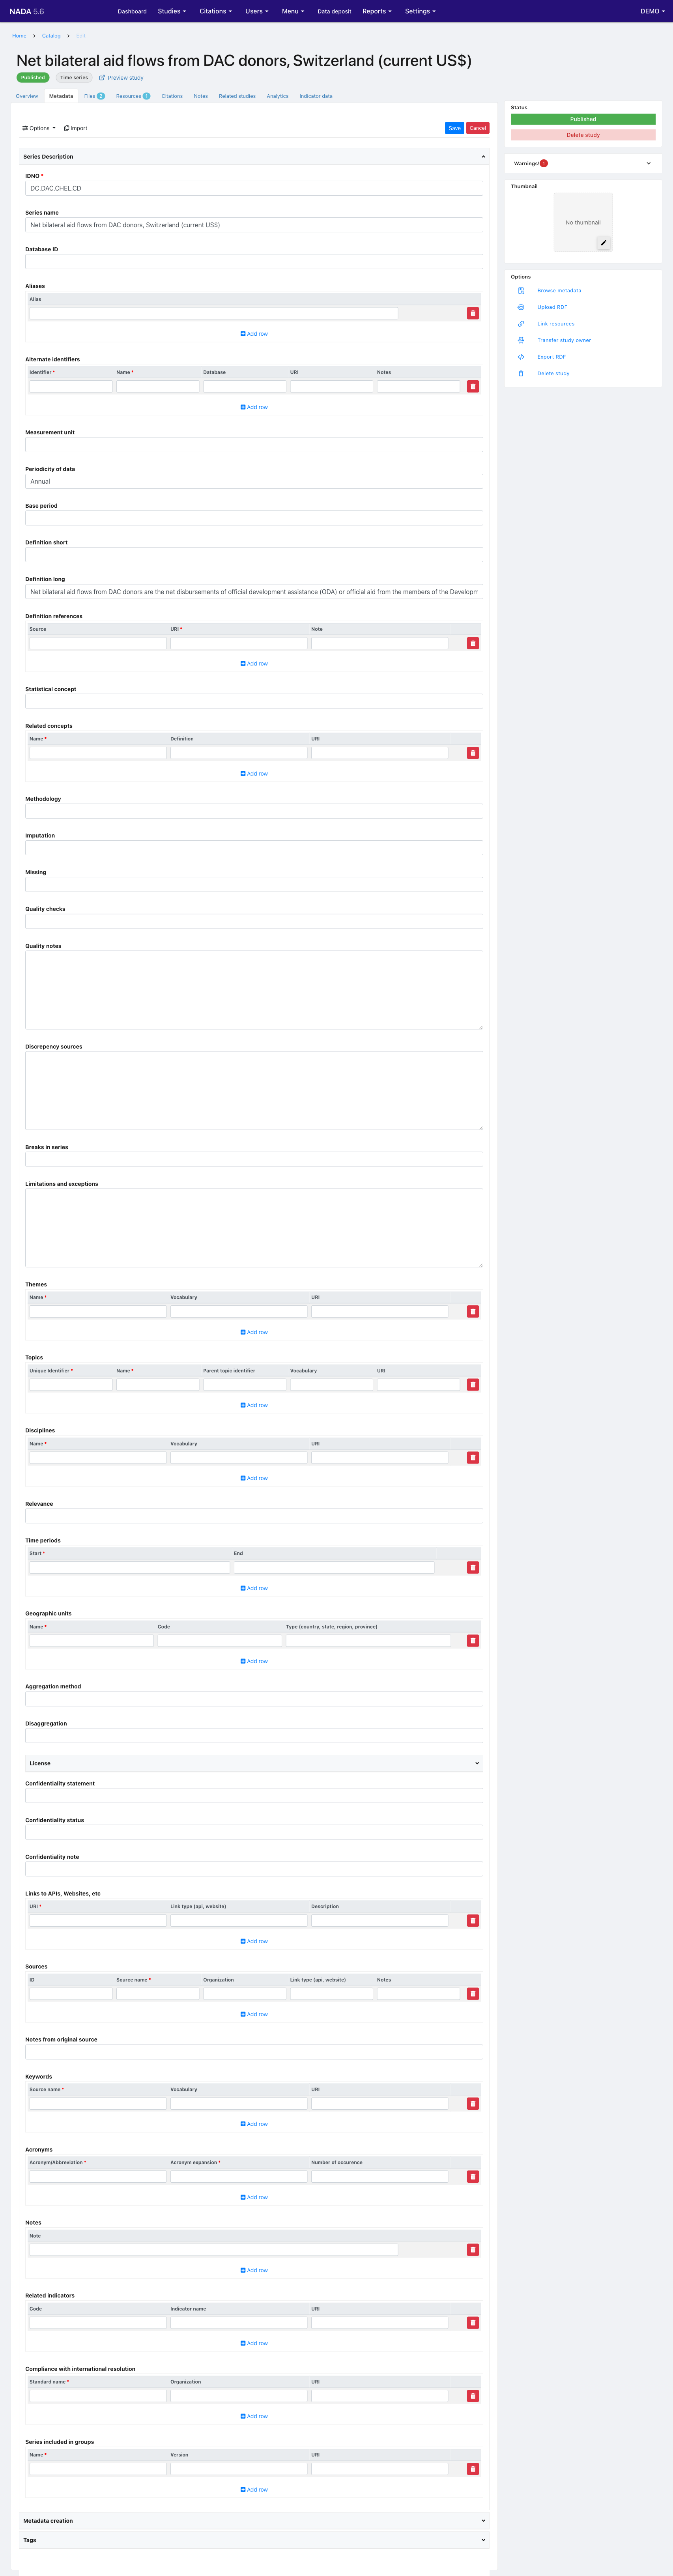
Click Save after making changes. Use Import to load metadata from a JSON file.
Uploading indicator data
Once the metadata is in place, upload the actual data through the Indicator data tab.
Attaching a data structure
Before uploading data, attach a DSD by selecting it from the Data structure dropdown. The DSD defines the expected columns and their types. Use Download template to get a blank CSV with the correct column headers.
Uploading a CSV file
Click Upload and select a CSV file. The file must contain columns matching the DSD component names. Non-DSD columns are accepted but ignored during structured queries.
After upload, the data is displayed in the Data preview table, showing columns such as DATASET, INDICATOR, INDICATOR_NAME, COUNTRY_CODE, FREQ, TIME_PERIOD, and OBS_VALUE.
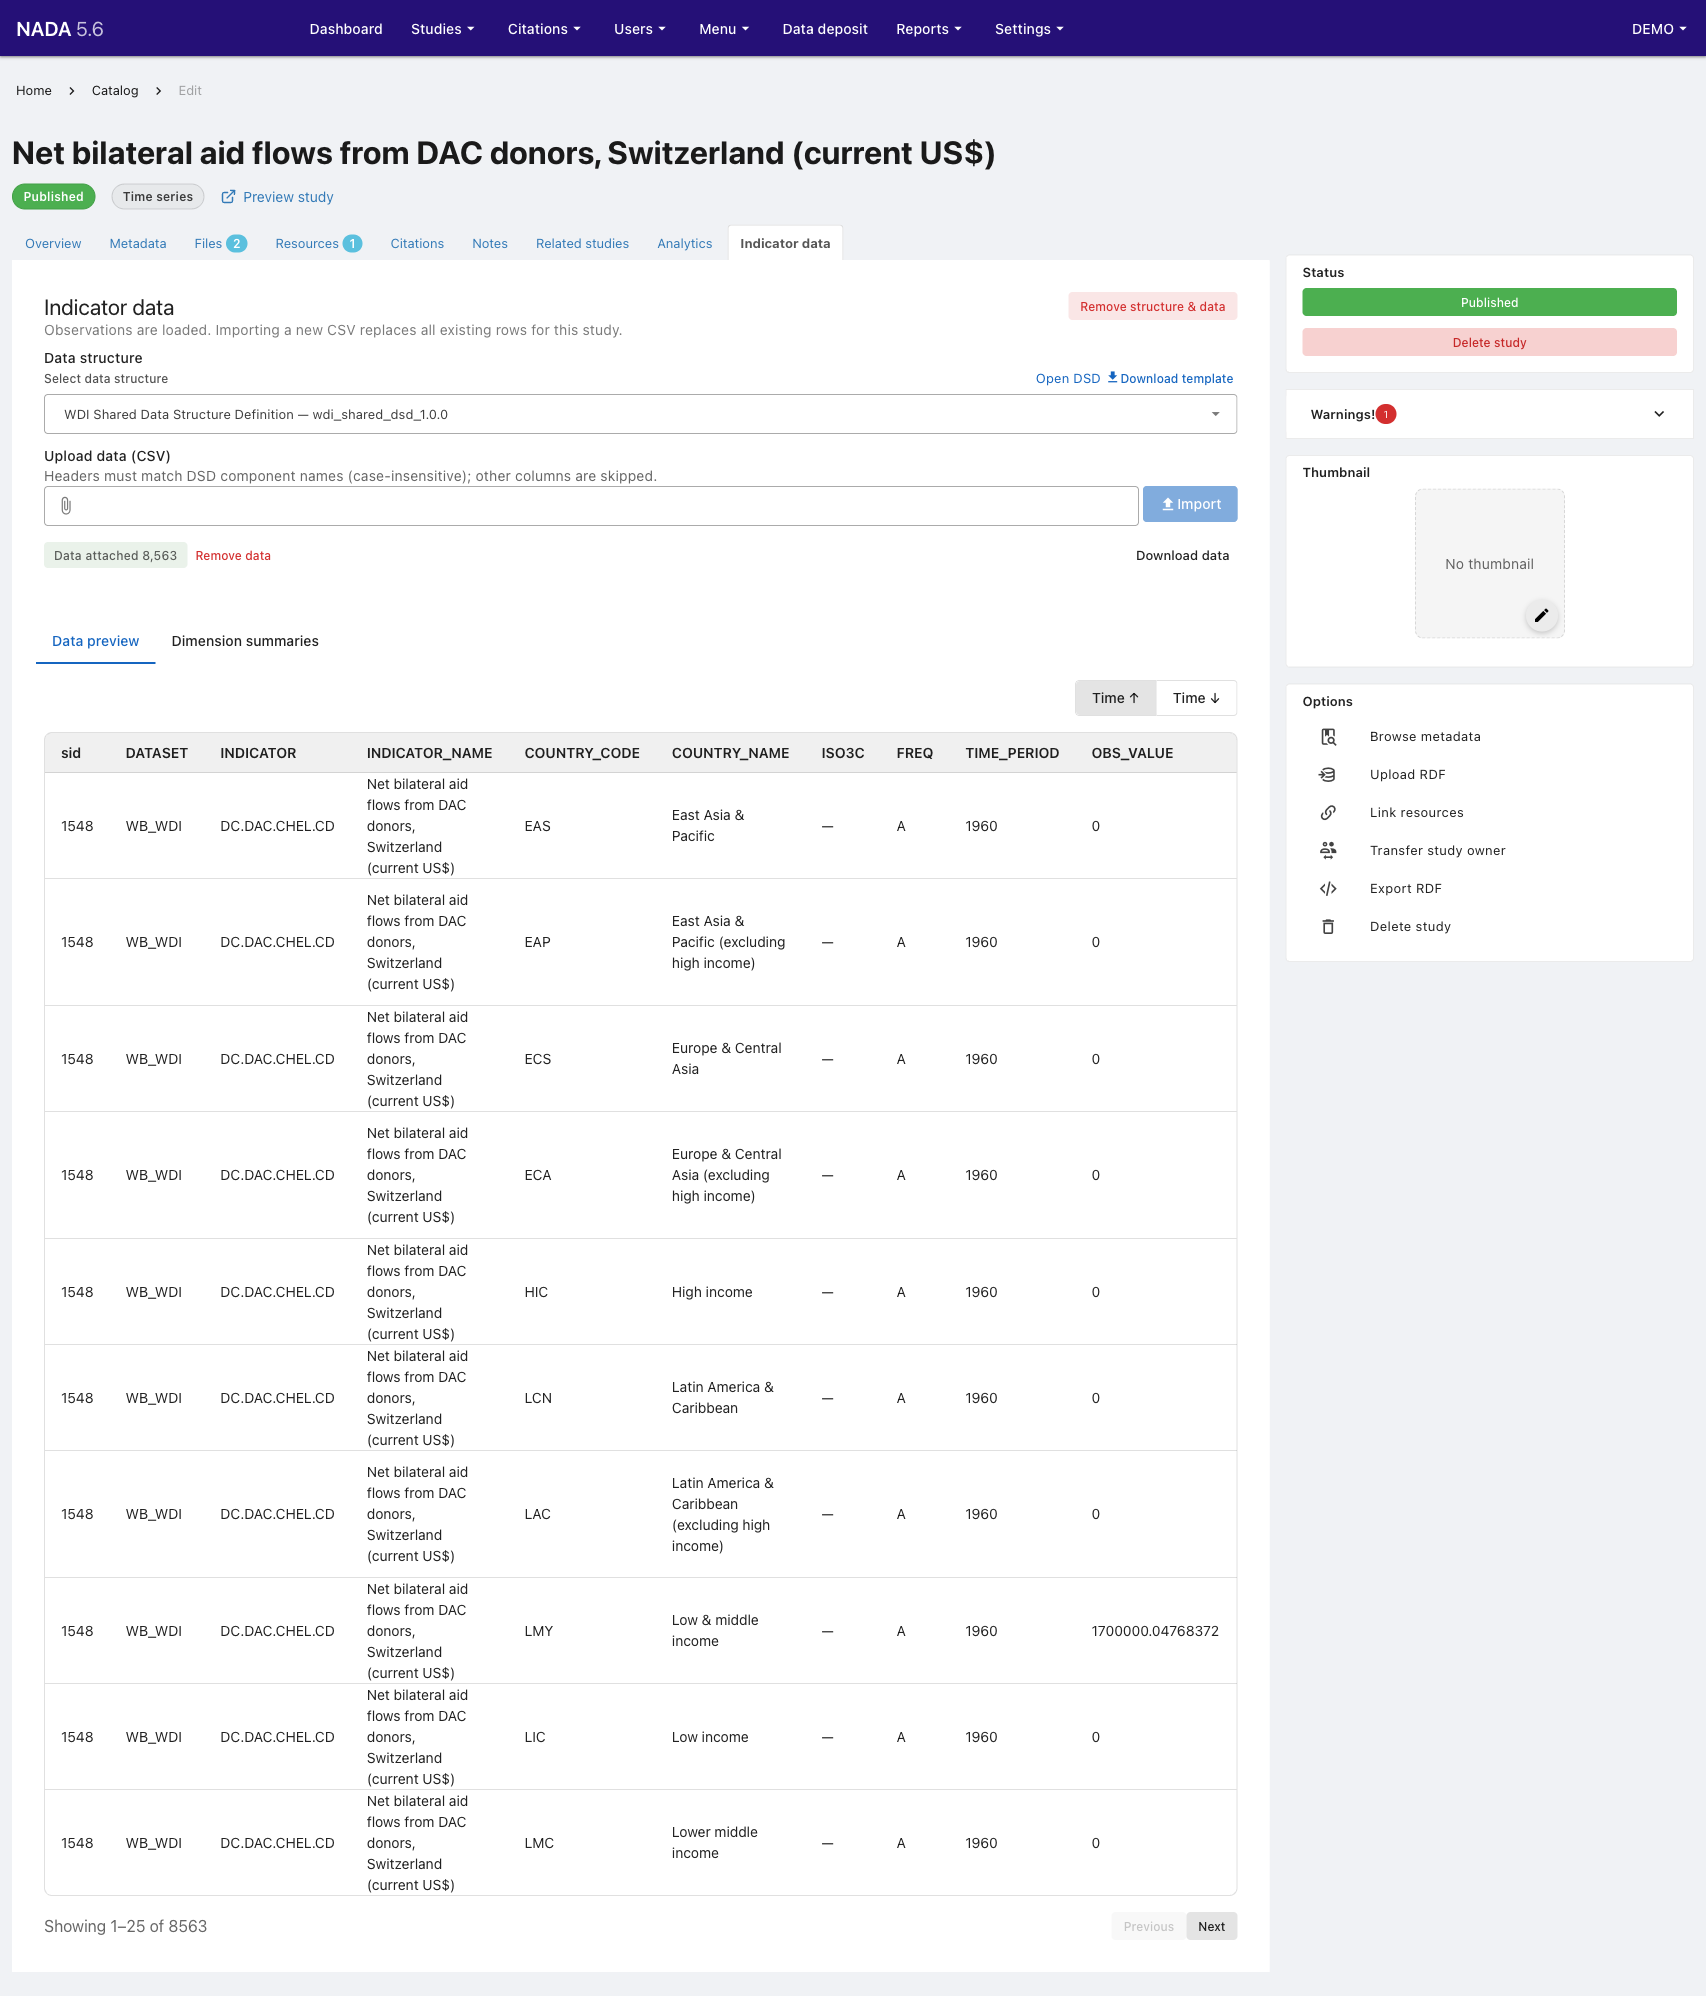
Use the Dimension summaries sub-tab to verify the range and distribution of values. Use Export CSV to download the currently loaded data, or Remove structure & data to start over.