Adding an indicator / time series
Also see:
- Admin UI — codelists, DSDs, and indicator projects
- Catalog frontend — what users see on a published series page

Indicators are summary (or "aggregated") measures related to key issues or phenomena, derived from a series of observed facts. Indicators form time series when provided with a temporal ordering, i.e. when their values are provided with an annual, quarterly, monthly, daily, or other time reference. In the context of this Guide, we consider as time series all indicators provided with an associated time, whether this time represents a regular, continuous series or not. For example, the indicators provided by the Demographic and Health Surveys (DHS) StatCompiler, which are only available for the years when DHS are conducted in countries (which for some countries can be a single year), would be considered as "time series".
Time series are often contained in multi-indicators databases, like the World Bank's World Development Indicators - WDI, whose on-line version contains 1,430 indicators (as of 2021). To document not only the series but also the databases they belong to, we propose two metadata schemas: one to document series/indicators, and one to document databases. In the NADA application, a series can be documented and published without an associated database, but information on a database will only be published when associated with a series. The information on a database is thus treated as an "attachment" to the information on a series.
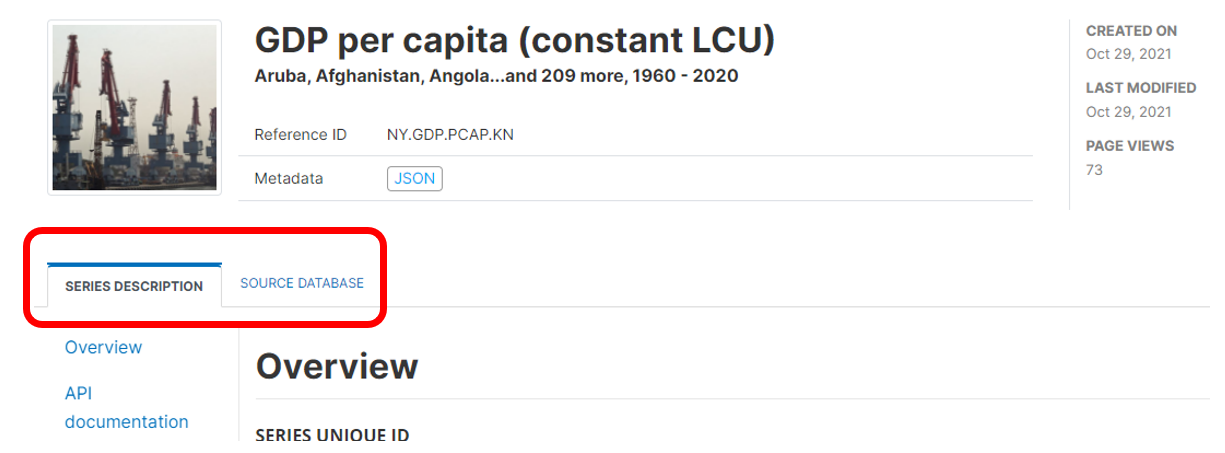
In a NADA catalog, a SERIES DESCRIPTION tab will display all metadata related to the series. The (optional) SOURCE DATABASE tab will display the metadata related to the database, is any. The database information is displayed for information; it is not indexed by the NADA catalog.
Metadata schemas
For documenting indicators/time series and their databases, NADA makes use of two metadata schemas developed by the World Bank Development Data Group: one for documenting the time series/indicators, the other one to document the database (if any) they belong to.
The documentation of the time series metadata schema is available at https://ihsn.github.io/nada-api-redoc/catalog-admin/#operation/createTimeSeries. The documentation of the database metadata schema is available at https://ihsn.github.io/nada-api-redoc/catalog-admin/#operation/createTimeseriesDB. A Schema Guide is also available, which provides more detailed information on the structure, content, and use of the metadata standards and schemas.
Loading metadata (web interface)
This option is currently not available. It will be added in a future version of NADA.
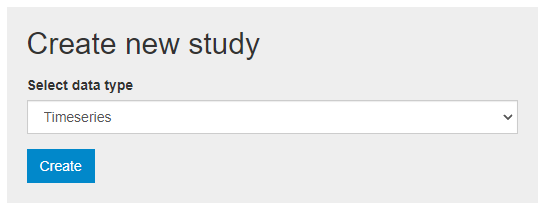
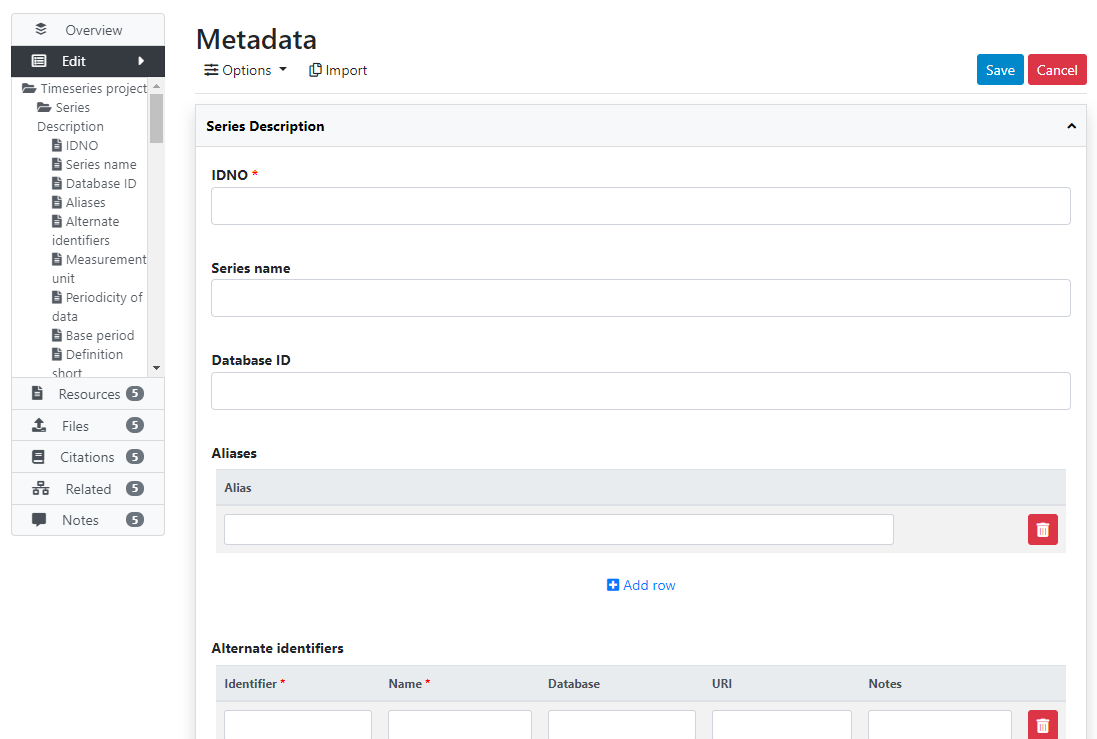
From scratch (web interface)
Loading metadata (API)
This option is currently not available. It will be added in a future version of NADA.
From scratch (API)
You can generate the metadata using R or Python, then publish it using the NADA API and the NADAR package or PyNADA library.
Use Case 007
# ==============================================================================
# NADA Demo Catalog - Use of API examples                      Use case ID: 007
#
# Use case description: document time series (extracted with their metadata from
# the World Bank World Development Indicators Database - WDI), and document the
# database (WDI), then publish the series metadata and the corresponding data
# in a NADA catalog with a chart.
#
# The published metadata will be structured using a schema described in:
#    https://ihsn.github.io/nada-api-redoc/catalog-admin/#tag/Timeseries
#
# Script tested with NADA version: 5.0
# Date: 2021-09-15
#
#   ** This script requires a valid API key with administrator privileges.**
#
# ==============================================================================

library(nadar)
library(jsonlite)
library(curl)
library(httr)
library(rlist)
library(dplyr)
library(tidyr)
library(readxl)
library(stringr)

# Set API key (stored in a CSV file; not to be entered in clear) and catalog URL

my_keys <- read.csv("C:/CONFIDENTIAL/my_keys.csv", header=F, stringsAsFactors=F)
set_api_key(my_keys[5,1])  # Assuming the key is in cell A5
set_api_url("http://nada-demo.ihsn.org/index.php/api/")
set_api_verbose(FALSE)

setwd("C:/Users/wb147665/OneDrive - WBG/_OD/NADA_HOW_TO/demo_files/UC007")

# ------------------------------------------------------------------------------
# Widgets to be used for visualizations and data preview
# ------------------------------------------------------------------------------

# Bar/line chart (eCharts)

widgets_delete("chart_line-bar")
widget_created <- FALSE
if(widget_created == FALSE) {
  widgets_create(
    uuid = "chart_line-bar",
    options = list(
      title = "Series chart",
      thumbnail = "thumbnail.jpg",
      description = "Series chart"
    ),
    zip_file = "WDI_chart_individual_series.zip"
  )
  widget_created = TRUE
}

# Choropleth world map(eCharts)

widgets_delete("map_world")
widget_created <- FALSE
if(widget_created == FALSE) {
  widgets_create(
    uuid = "map_world",
    options = list(
      title = "Map",
      thumbnail = "thumbnail.jpg",
      description = "Choropleth map"
    ),
    zip_file = "WDI_map_individual_series.zip"
  )
  widget_created = TRUE
}

# Race chart (eCharts)

widgets_delete("race_chart")
widget_created <- FALSE
if(widget_created == FALSE) {
  widgets_create(
    uuid = "race_chart",
    options = list(
      title = "Race chart",
      description = "Race chart"
    ),
    zip_file = "WDI_bar_race_chart.zip"
  )
  widget_created = TRUE
}

# Data preview (Tabulator)

widgets_delete("data_preview_tabulator")
widget_created <- FALSE
if(widget_created == FALSE) {
  widgets_create(
    uuid = "data_preview_tabulator",
    options = list(
      title = "Data preview",
      thumbnail = "grid.jpg",
      description = "Data preview"
    ),
    zip_file = "WDI_grid_individual_series.zip"
  )
  widget_created = TRUE
}

# ------------------------------------------------------------------------------

#-------------------------------------------------------------------------------
# Selection of WDI series to be published
# Note: the script extracts information for ALL time series available in the
# WDI database (1443); but only the selected series will be published

selected_series <- list("SP.POP.TOTL",
                        "SI.POV.DDAY",
                        "NY.GDP.PCAP.KN",
                        "NY.GDP.PCAP.PP.KD",
                        "SP.DYN.IMRT.IN",
                        "SP.POP.DPND",
                        "SM.POP.REFG",
                        "SM.POP.REFG.OR",
                        "SH.STA.STNT.ZS",
                        "IQ.SPI.OVRL")

# List of series for which we want to include a choropleth map
map_it <- c("SI.POV.DDAY", "NY.GDP.PCAP.PP.KD", "SP.DYN.IMRT.IN", "SP.POP.DPND",
            "SH.STA.STNT.ZS", "IQ.SPI.OVRL", "SM.POP.REFG.OR", "SM.POP.REFG")
#-------------------------------------------------------------------------------

# Information on the producer of WDI:

src_prod   <- list(name = "Development Data Group",
                   role = "Producer",
                   affiliation = "The World Bank Group")

# REMINDER: the Time Series schema has two main sections:
# - One section contains elements to document the time series
# - One section contains elements to document the database from which the series
#   is extracted.
# The first section is required to publish metadata in NADA.
# The second section is optional. It will only be displayed as an "attachment"
# to a series metadata.

# ------------------------------------------------------------------------------
# We extract information from the World Bank Data Catalog API that we will use
# to generate metadata for the DATABASE section.
# Information on the WB data catalog API can be found at:
#   https://datahelpdesk.worldbank.org/knowledgebase/topics/125589
# ------------------------------------------------------------------------------

url = "https://api.worldbank.org/v2/datacatalog/metatypes?format=json"
WB_catalog <- GET(url)

if(http_error(WB_catalog)){
  stop("The request failed")
} else {
  info <- fromJSON(content(WB_catalog, as = "text"))
}

# The ID of the WDI database is "1"
src_name  <- info$datacatalog$metatype[[1]]$value[1]  # Name
src_acron <- info$datacatalog$metatype[[1]]$value[2]  # Acronym
src_descr <- info$datacatalog$metatype[[1]]$value[3]  # Description
src_url   <- info$datacatalog$metatype[[1]]$value[4]  # URL
src_type  <- info$datacatalog$metatype[[1]]$value[5]  # Type
src_lang  <- info$datacatalog$metatype[[1]]$value[6]  # Languages supported
src_perio <- info$datacatalog$metatype[[1]]$value[7]  # Periodicity
src_ecoco <- info$datacatalog$metatype[[1]]$value[8]  # Economy coverage
src_granu <- info$datacatalog$metatype[[1]]$value[9]  # Granularity
src_nbeco <- info$datacatalog$metatype[[1]]$value[10] # Nb of economies
src_topic <- info$datacatalog$metatype[[1]]$value[11] # Topics
src_updfr <- info$datacatalog$metatype[[1]]$value[12] # Update frequency
src_updsc <- info$datacatalog$metatype[[1]]$value[13] # Update schedule
src_lastr <- info$datacatalog$metatype[[1]]$value[14] # Last revision
src_conta <- info$datacatalog$metatype[[1]]$value[15] # Contact
src_acopt <- info$datacatalog$metatype[[1]]$value[16] # Access options
src_bulkd <- info$datacatalog$metatype[[1]]$value[17] # Bulk download (not used)
src_cite  <- info$datacatalog$metatype[[1]]$value[18] # Cite
src_pageu <- info$datacatalog$metatype[[1]]$value[19] # Detail page url
src_popul <- info$datacatalog$metatype[[1]]$value[20] # Popularity (not used)
src_yrcov <- info$datacatalog$metatype[[1]]$value[21] # Coverage (years)
src_api   <- info$datacatalog$metatype[[1]]$value[22] # API (not used)
src_apiur <- info$datacatalog$metatype[[1]]$value[23] # API access url
src_apiid <- info$datacatalog$metatype[[1]]$value[24] # API source ID (not used)

# We split the information extracted on language
# (make it a list with codes and names as required by our metadata schema)

lang <- as.list(strsplit(src_lang, ', ')[[1]])
list_lang <- list()
for (i in 1:length(lang)){
  if (lang[[i]] == "English") cc = "en"
  if (lang[[i]] == "French")  cc = "fr"
  if (lang[[i]] == "Spanish") cc = "sp"
  if (lang[[i]] == "Russian") cc = "ru"
  if (lang[[i]] == "Arabic")  cc = "ar"
  if (lang[[i]] == "Chinese") cc = "cn"
  list_lang[[i]] <- list(name = lang[[i]], code = cc)
}

# We split the information extracted on topics
# (make it a list with codes and names as required by our metadata schema)

list_topics <-list()
top <- strsplit(src_topic, ",")
for(t in top[[1]]) {
  t <- str_trim(t, side = c("both")) # Trim whitespaces
  list_topics <- list.append(list_topics, list(id = "", name=t))
}

# ------------------------------------------------------------------------------
# We extract some additional information from WDI API (last update, and year)
# ------------------------------------------------------------------------------

url = "http://api.worldbank.org/v2/source/2?format=json"
WB_sources <- GET(url)

if(http_error(WB_sources)){
  stop("The request failed")
} else {
  sources <- fromJSON(content(WB_sources, as = "text"))[[2]]
}

# Core metadata
src_update  <- sources$lastupdated
src_year    <- substr(sources$lastupdated, start=1, stop = 4)
src_id      <- paste0("WLD_", src_year, "_", src_acron, "_v01_M")
src_version <- list(
  list(version = src_update,
       date = src_update,
       responsibility = "World Bank, Development Data Group")
)

# ------------------------------------------------------------------------------
# We extracting information on the time series from CSV files available on-line
# (bulk import). For each series, we identify the countries and years with data.
# We also derive the list of countries and year range for the whole database.
# ------------------------------------------------------------------------------

# Download and unzip WDI CSV files if not previously done
if(!file.exists("WDI_csv.zip")) {
  download.file("http://databank.worldbank.org/data/download/WDI_csv.zip",
                "WDI_csv.zip")
}
# Unzip the file, and read some of the CSV files it contains
unzip(zipfile = "WDI_csv.zip", exdir = getwd())
wdi_ser <- read.csv("WDISeries.csv", header = T, sep = ",", encoding="UTF-8")
wdi_dat <- read.csv("WDIData.csv", header = T, sep = ",", encoding="UTF-8")
wdi_cty <- read.csv("WDICountry.csv", header = T, sep = ",", encoding="UTF-8")

# Convert factors to characters in data frames
wdi_ser <- rapply(wdi_ser, as.character, classes = "factor", how = "replace")
wdi_dat <- rapply(wdi_dat, as.character, classes = "factor", how = "replace")
wdi_cty <- rapply(wdi_cty, as.character, classes = "factor", how = "replace")

# Check that the number of series in WDIData corresponds to the number of series
# for which metadata are provided in WDISeries
stopifnot(identical(length(unique(wdi_dat$Indicator.Code)),
                    length(unique(wdi_ser$X.U.FEFF.Series.Code))))

# Comma-separated list of countries in database
ctries <- wdi_cty %>%
          select(Short.Name, X.U.FEFF.Country.Code) %>%
          spread(X.U.FEFF.Country.Code, Short.Name)
ctries_l <- list()
for(c in 1:length(ctries)) {
  ctries_l[[c]] <- list(name = as.character(ctries[c]),
                        code = names(ctries)[c])
}

# Reshape the data file to identify the range of years with data, by series
wdi_dat2 <- gather(wdi_dat,
                   year,
                   value,
                   -X.U.FEFF.Country.Name,
                   -Country.Code,
                   -Indicator.Name,
                   -Indicator.Code)
wdi_dat2$X <- NULL
wdi_dat2 <- wdi_dat2 %>% drop_na(value)
wdi_dat2$year <- as.numeric(substr(wdi_dat2$year, start = 2, stop = 5))

ser_yrs <- wdi_dat2 %>%
  group_by(Indicator.Code) %>%
  summarise(min_year = min(year, na.rm = TRUE),
            max_year = max(year, na.rm = TRUE))

wdi_ser <- wdi_ser %>%
           left_join(ser_yrs, by = c("X.U.FEFF.Series.Code" = "Indicator.Code"))
wdi_ser$X <- NULL

src_start <- min(wdi_ser$min_year, na.rm = TRUE)
src_end   <- max(wdi_ser$max_year, na.rm = TRUE)

# Reshape the data file to identify the list of countries with data, by series

wdi_dat3 <- wdi_dat2 %>%
            filter(Indicator.Code %in% selected_series) %>%
            drop_na(value) %>%
            arrange(Indicator.Code) %>%
            group_by(Indicator.Code, Country.Code) %>%
            summarize(mv = 1) %>%
            group_by(Indicator.Code) %>%
            mutate(ctry = 1:n()) %>%
            spread(ctry, Country.Code) %>%
            mutate_if(is.factor, as.character)

wdi_dat3[is.na(wdi_dat3)] <- ""
wdi_dat3 <- as.data.frame(wdi_dat3)

wdi_dat3$countries <- apply(wdi_dat3[ ,3:267], 1, paste, collapse = ' ')
wdi_dat3 <- wdi_dat3 %>% select(Indicator.Code, countries)

wdi_ser <- wdi_ser %>%
           filter(X.U.FEFF.Series.Code %in% selected_series) %>%
           left_join(wdi_dat3, by = c("X.U.FEFF.Series.Code" = "Indicator.Code"))

# Generate API links for each series, in XML and Jason formats

wdi_ser$url_data_J <- paste0(
  "https://api.worldbank.org/v2/countries/all/indicators/",
  wdi_ser$X.U.FEFF.Series.Code, "?date=", wdi_ser$min_year, ":", wdi_ser$max_year,
  "&format=json")

wdi_ser$url_data_X <- paste0(
  "https://api.worldbank.org/v2/countries/all/indicators/",
  wdi_ser$X.U.FEFF.Series.Code, "?date=", wdi_ser$min_year, ":", wdi_ser$max_year)

wdi_ser$url_meta_J <- paste0(
  "https://api.worldbank.org/v2/sources/2/series/",
  tolower(wdi_ser$X.U.FEFF.Series.Code), "/metadata?format=json")

wdi_ser$url_meta_X <- paste0(
  "https://api.worldbank.org/v2/sources/2/series/",
  tolower(wdi_ser$X.U.FEFF.Series.Code), "/metadata")

# Add the URL license (series ar CC BY-4.0)

wdi_ser$License.Url <- ""
wdi_ser$License.Url[wdi_ser$License.Type=="CC BY-4.0"] <-
  "https://creativecommons.org/licenses/by/4.0/"

# ------------------------------------------------------------------------------
# GENERATE THE DATABASE-LEVEL METADATA FOR NADA
# ------------------------------------------------------------------------------

wdi_db <- list(

  database_description = list(

    title_statement = list(
      idno = src_id,
      title = src_name,
      alternate_title = src_acron
    ),
    authoring_entity = list(src_prod),
    abstract = src_descr,
    url = src_url,
    type = "Time series database",
    date_created = src_update,
    date_published = src_update,
    version = src_version,
    update_frequency = src_updfr,
    update_schedule = list(list(update = src_updsc)),
    time_coverage = list(list(start = toString(src_start),
                              end = toString(src_end))),
    periodicity = list(list(period = src_perio)),
    topics = list_topics,
    geographic_units = ctries_l,
    geographic_granularity = "global, national, regional",
    geographic_area_count = toString(length(ctries_l)),
    languages = list_lang,
    contacts = list(list(name="Data Help Desk",
                         affiliation="World Bank",
                         uri="https://datahelpdesk.worldbank.org/",
                         email="data@worldbank.org")),
    access_options = list(
      list(type="API",
           uri="https://datahelpdesk.worldbank.org/knowledgebase/articles/889386"),
      list(type="Bulk",
           uri="https://data.worldbank.org/data-catalog/world-development-indicators"),
      list(type="Query",
           uri="http://databank.worldbank.org/data/source/world-development-indicators"),
      list(type="PDF",
           uri="https://openknowledge.worldbank.org/bitstream/handle/10986/26447/WDI-2017-web.pdf")),
    license = list(list(type="CC BY-4.0", uri="https://creativecommons.org/licenses/by/4.0/")),
    citation = src_cite
  )
)

timeseries_database_add(idno = src_id,
                        published = 1,
                        overwrite = "yes",
                        metadata = wdi_db)

# --------------------------------------------------------------------------------------
# GENERATE SERIES-LEVEL METADATA AND PUBLISH IN NADA
# --------------------------------------------------------------------------------------

this_series <- list()

for (row in 1:nrow(wdi_ser)){

  # Skip series that are not selected
  if (wdi_ser$X.U.FEFF.Series.Code[row] %in% selected_series == FALSE) {
    next
  }

  # Get list of countries as list of country codes with no empty element
  x <- strsplit(wdi_ser$countries[row], " ")[[1]]
  x <- x[x != ""]
  geo_u <- list()
  for (i in 1: length(x)) {
    cname = get(x[i], ctries)
    geo_u[[i]] = list(name=cname, code=x[i], type="")
  }

  # Split information on topics (make it a list of lists)
  list_topics_series <-list()
  top <- strsplit(wdi_ser$Topic[row], ",")
  for(t in top[[1]]) {
    list_topics_series <- list.append(
      list_topics_series,
      list(id = "", name = t))
  }

  # We add selected keywords where relevant
  keyw = list()
  if(grepl("global financial inclusion database", tolower(wdi_ser$Source[row]))) {
    keyw <- list.append(keyw, list(name = "findex"))
  }
  if(grepl("povcalnet", tolower(wdi_ser$Source[row]))) {
    keyw <- list.append(keyw, list(name = "povcal"))
  }

  # Generate series metadata for NADA
  this_series <- list(

    series_description = list(

      idno                   = wdi_ser$X.U.FEFF.Series.Code[row],
      name                   = wdi_ser$Indicator.Name[row],
      database_id            = wdi_db$database_description$title_statement$idno,
      measurement_unit       = wdi_ser$Unit.of.measure[row],
      periodicity            = wdi_ser$Periodicity[row],
      base_period            = wdi_ser$Base.Period[row],
      definition_short       = wdi_ser$Short.definition[row],
      definition_long        = wdi_ser$Long.definition[row],
      methodology            = wdi_ser$Statistical.concept.and.methodology[row],
      limitation             = wdi_ser$Limitations.and.exceptions[row],
      topics                 = list_topics_series,
      relevance              = wdi_ser$Development.relevance[row],
      time_periods           = list(list(start = as.character(wdi_ser$min_year[row]),
                                         end = as.character(wdi_ser$max_year[row]))),
      geographic_units       = geo_u,
      aggregation_method     = wdi_ser$Aggregation.method[row],
      license                = list(type = wdi_ser$License.Type[row],
                                    uri = wdi_ser$License.Url[row]),
      links                  = list(list(type = "API",
                                         description = "Data in JSON",
                                         uri = wdi_ser$url_data_J[row]),
                                    list(type = "API",
                                         description = "Data in XML",
                                         uri = wdi_ser$url_data_X[row]),
                                    list(type = "API",
                                         description = "Metadata in JSON",
                                         uri = wdi_ser$url_meta_J[row]),
                                    list(type = "API",
                                         description = "Metadata in XML" ,
                                         uri = wdi_ser$url_meta_X[row])
                               ),
      api_documentation      = list(description = "See the Developer Information webpage for detailed documentation of the API",
                                    uri = "https://datahelpdesk.worldbank.org/knowledgebase/topics/125589-developer-information"),
      source                 = wdi_ser$Source[row],
      source_note            = wdi_ser$Note[row],
      keywords               = keyw,
      notes                  = list(list(note = wdi_ser$Other.notes[row]))

    )

  )

  # We want to apply thumbnails specific to each series

  thumb = "thumb_wdi.jpg"  #Default thumbnail file
  if(wdi_ser$X.U.FEFF.Series.Code[row] == "SP.POP.TOTL") thumb = "thumb_pop.jpg"
  if(wdi_ser$X.U.FEFF.Series.Code[row] == "SI.POV.DDAY") thumb = "thumb_pov.jpg"
  if(wdi_ser$X.U.FEFF.Series.Code[row] == "NY.GDP.PCAP.KN") thumb = "thumb_eco.jpg"
  if(wdi_ser$X.U.FEFF.Series.Code[row] == "NY.GDP.PCAP.PP.KD") thumb = "thumb_eco.jpg"
  if(wdi_ser$X.U.FEFF.Series.Code[row] == "SP.DYN.IMRT.IN") thumb = "thumb_hea.jpg"
  if(wdi_ser$X.U.FEFF.Series.Code[row] == "SP.POP.DPND") thumb = "thumb_dep.jpg"
  if(wdi_ser$X.U.FEFF.Series.Code[row] == "SM.POP.REFG") thumb = "thumb_refugee.jpg"
  if(wdi_ser$X.U.FEFF.Series.Code[row] == "SM.POP.REFG.OR") thumb = "thumb_refugee.jpg"
  if(wdi_ser$X.U.FEFF.Series.Code[row] == "SH.STA.STNT.ZS") thumb = "thumb_stunt.jpg"
  if(wdi_ser$X.U.FEFF.Series.Code[row] == "IQ.SPI.OVRL") thumb = "thumb_spi.jpg"

  # Publish the metadata in NADA

  timeseries_add(
    idno = this_series$series_description$idno,
    repositoryid = "central",
    published = 1,
    overwrite = "yes",
    metadata = this_series,
    thumbnail = thumb
)# ==============================================================================
# NADA Demo Catalog - Use of API examples Use case ID: 007
#
# Use case description: document time series (extracted with their metadata from
# the World Bank World Development Indicators Database - WDI), and document the
# database (WDI), then publish the series metadata and the corresponding data
# in a NADA catalog with a chart.
#
# The published metadata will be structured using a schema described in:
# https://ihsn.github.io/nada-api-redoc/catalog-admin/#tag/Timeseries
#
# Script tested with NADA version: 5.0
# Date: 2021-09-15
#
# ** This script requires a valid API key with administrator privileges.**
#
# ==============================================================================
import json
import os
import sys
import numpy as np
import pynada as nada
import pandas as pd
import urllib.request
from zipfile import ZipFile
my_keys = pd.read_csv("../confidential/my_keys.csv", header=None)
nada.set_api_key(my_keys.iat[4, 0]) # Assuming the key is in cell A5
nada.set_api_url('https://nada-demo.ihsn.org/index.php/api/')
os.chdir("demo_nada_files/UC007")
# # -------------------------------------------------------------------------------
# # Selection of WDI series to be published
# # Note: the script extracts information for ALL time series available in the
# # WDI database (1443); but only the selected series will be published
selected_series = ["SP.POP.TOTL",
"SI.POV.DDAY",
"NY.GDP.PCAP.KN",
"NY.GDP.PCAP.PP.KD",
"SP.DYN.IMRT.IN",
"SP.POP.DPND"]
# List of series for which we want to include a choropleth map
map_it = ["SI.POV.DDAY", "NY.GDP.PCAP.PP.KD", "SP.DYN.IMRT.IN", "SP.POP.DPND"]
# # -------------------------------------------------------------------------------
# Information on the producer of WDI:
src_prod = [{"name": "Development Data Group",
"role": "Producer",
"affiliation": "The World Bank Group"}]
# REMINDER: the Time Series schema has two main sections:
# - One section contains elements to document the time series
# - One section contains elements to document the database from which the series
# is extracted.
# The first section is required to publish metadata in NADA.
# The second section is optional. It will only be displayed as an "attachment"
# to a series metadata.
# ------------------------------------------------------------------------------
# We extract information from the World Bank Data Catalog API that we will use
# to generate metadata for the DATABASE section.
# Information on the WB data catalog API can be found at:
# https://datahelpdesk.worldbank.org/knowledgebase/topics/125589
# ------------------------------------------------------------------------------
url = "https://api.worldbank.org/v2/datacatalog/metatypes?format=json"
try:
WB_catalog = urllib.request.urlopen(url)
except Exception as e:
print(f"The request failed - {e}")
exit()
info = json.loads(WB_catalog.read())
# The id of the WDI database is "0"
src_name = info['datacatalog'][0]['metatype'][0]['value'] # Name
src_acron = info['datacatalog'][0]['metatype'][1]['value'] # Acronym
src_descr = info['datacatalog'][0]['metatype'][2]['value'] # Description
src_url = info['datacatalog'][0]['metatype'][3]['value'] # URL
src_type = info['datacatalog'][0]['metatype'][4]['value'] # Type
src_lang = info['datacatalog'][0]['metatype'][5]['value'] # Languages supported
src_period = info['datacatalog'][0]['metatype'][6]['value'] # Periodicity
src_ecoco = info['datacatalog'][0]['metatype'][7]['value'] # Economy coverage
src_granu = info['datacatalog'][0]['metatype'][8]['value'] # Granularity
src_nbeco = info['datacatalog'][0]['metatype'][9]['value'] # Nb of economies
src_topic = info['datacatalog'][0]['metatype'][10]['value'] # Topics
src_updfr = info['datacatalog'][0]['metatype'][11]['value'] # Update frequency
src_updsc = info['datacatalog'][0]['metatype'][12]['value'] # Update schedule
src_lastr = info['datacatalog'][0]['metatype'][13]['value'] # Last revision
src_conta = info['datacatalog'][0]['metatype'][14]['value'] # Contact
src_acopt = info['datacatalog'][0]['metatype'][15]['value'] # Access options
src_bulkd = info['datacatalog'][0]['metatype'][16]['value'] # Bulk download (not used)
src_cite = info['datacatalog'][0]['metatype'][17]['value'] # Cite
src_pageu = info['datacatalog'][0]['metatype'][18]['value'] # Detail page url
src_popul = info['datacatalog'][0]['metatype'][19]['value'] # Popularity (not used)
src_yrcov = info['datacatalog'][0]['metatype'][20]['value'] # Coverage (years)
src_api = info['datacatalog'][0]['metatype'][21]['value'] # API (not used)
src_apiur = info['datacatalog'][0]['metatype'][22]['value'] # API access url
src_apiid = info['datacatalog'][0]['metatype'][23]['value'] # API source ID (not used)
# We split the information extracted on language
# (make it a list of dictionaries with codes and names as required by our metadata schema)
lang = src_lang.split(",")
list_lang = []
for l in lang:
ldict = {"name": (l.strip()), "code": ""}
list_lang.append(ldict)
for i in list_lang:
if i['name'] == "English": i['code'] = "en"
if i['name'] == "French": i['code'] = "fr"
if i['name'] == "Spanish": i['code'] = "sp"
if i['name'] == "Russian": i['code'] = "ru"
if i['name'] == "Arabic": i['code'] = "ar"
if i['name'] == "Chinese": i['code'] = "cn"
# We split the information extracted on topics
# (make it a list of dictionaries with codes and names as required by our metadata schema)
list_topics = []
top = src_topic.split(",")
for t in top:
tdict = {"id": "", "name": (t.strip())}
list_topics.append(tdict)
# ------------------------------------------------------------------------------
# We extract some additional information from WDI API (last update, and year)
# ------------------------------------------------------------------------------
url = "http://api.worldbank.org/v2/source/2?format=json"
try:
WB_sources = urllib.request.urlopen(url)
except Exception as e:
print("The request failed")
exit()
sources = json.loads(WB_sources.read())[1][0]
# Core metadata
src_update = sources['lastupdated']
src_year = sources['lastupdated'][0:4]
src_id = "WLD_" + src_year + "_" + src_acron + "_v01_M"
src_version = [{"version": src_update,
"date": src_update,
"responsibility": "World Bank, Development Data Group"}]
# ------------------------------------------------------------------------------
# We extracting information on the time series from CSV files available on-line
# (bulk import). For each series, we identify the countries and years with data.
# We also derive the list of countries and year range for the whole database.
# ------------------------------------------------------------------------------
# Download and unzip WDI CSV files if not previously done
if not os.path.exists("WDI_csv.zip"):
nada.download_file("http://databank.worldbank.org/data/download/WDI_csv.zip", "WDI_csv.zip")
# Unzip the file, and read some of the CSV files it contains
with ZipFile("WDI_csv.zip", 'r') as z:
z.extractall(os.getcwd())
wdi_ser = pd.read_csv("WDISeries.csv", header='infer', sep=",", encoding="utf-8")
wdi_ser = wdi_ser.loc[:, ~wdi_ser.columns.str.match('Unnamed')] # drop sys generated unnamed column full of nan
wdi_dat = pd.read_csv("WDIData.csv", header='infer', sep=",", encoding="utf-8")
wdi_dat = wdi_dat.loc[:, ~wdi_dat.columns.str.match('Unnamed')] # drop sys generated unnamed column full of nan
wdi_cty = pd.read_csv("WDICountry.csv", header='infer', sep=",", encoding="utf-8")
wdi_cty = wdi_cty.loc[:, ~wdi_cty.columns.str.match('Unnamed')] # drop sys generated unnamed column full of nan
# Convert factors to characters in data frames
def cat_tostring(var):
return var.astype(str) if type(var) == "category" else var
dfs = ['wdi_ser', 'wdi_dat', 'wdi_cty']
for d in dfs:
df = eval(d)
df.applymap(lambda x: cat_tostring(x))
# Check that the number of series in WDIData corresponds to the number of series
# for which metadata are provided in WDISeries
try:
assert (len(pd.unique(wdi_dat['Indicator Code'])) == len(pd.unique(wdi_ser['Series Code'])))
except AssertionError:
sys.exit("Number of series in WDIData series does not correspond to number of series in WDISeries")
# Comma-separated list of countries in database
ctries_l = []
ctries = wdi_cty[['Short Name', 'Country Code']].values.tolist()
for c in range(len(ctries)):
cd = {"name": ctries[c][0], "code": ctries[c][1]}
ctries_l.append(cd)
wdi_dat2 = wdi_dat.melt(id_vars=['Country Name', 'Country Code', 'Indicator Name', 'Indicator Code'], var_name="year",
value_name="value")
wdi_dat2['year'] = wdi_dat2['year'].astype(int)
# Reshape the data file to identify the range of years with data, by series
wdi_dat2 = wdi_dat2[wdi_dat2.value.notnull()]
ser_yrs = wdi_dat2.groupby('Indicator Code').agg(min_year=('year', 'min'), max_year=('year', 'max'))
wdi_ser = pd.merge(wdi_ser, ser_yrs, left_on=["Series Code"], right_on=["Indicator Code"], how='left')
src_start = int((wdi_ser['min_year'].min(skipna=True)))
src_end = int(wdi_ser['max_year'].max(skipna=True))
# Reshape the data file to identify the list of countries with data, by series
wdi_dat3 = wdi_dat2[wdi_dat2['Indicator Code'].isin(selected_series)]
wdi_dat3 = wdi_dat3[wdi_dat3['value'].notnull()]
wdi_dat3 = wdi_dat3.sort_values(by=['Indicator Code']).groupby(['Indicator Code', 'Country Code']).count().reset_index()
wdi_dat3 = wdi_dat3[['Indicator Code', 'Country Code']]
wdi_dat3['ctry'] = wdi_dat3.groupby('Indicator Code').cumcount() + 1
wdi_dat3 = wdi_dat3.pivot(index=["Indicator Code"], columns=["ctry"], values=["Country Code"])
wdi_dat3 = wdi_dat3.applymap(lambda col: cat_tostring(col))
wdi_dat3['countries'] = wdi_dat3[wdi_dat3.columns[0:]].apply(
lambda ctry: ' '.join(ctry.dropna().astype(str)),
axis=1
)
wdi_dat3 = wdi_dat3['countries'].reset_index()
wdi_ser = wdi_ser[wdi_ser['Series Code'].isin(selected_series)]
wdi_ser = pd.merge(wdi_ser, wdi_dat3, left_on=["Series Code"], right_on=["Indicator Code"], how='left')
assert (wdi_ser['Indicator Code'].equals(wdi_ser['Series Code'])) # series code and indicator code exist in merged df
wdi_ser = wdi_ser.drop(columns=['Indicator Code'])
wdi_ser['min_year'] = wdi_ser['min_year'].astype(int)
wdi_ser['max_year'] = wdi_ser['max_year'].astype(int)
wdi_ser = wdi_ser.fillna("")
# Generate API links for each series, in XML and Jason formats
wdi_ser['url_data_J'] = "https://api.worldbank.org/v2/countries/all/indicators/" \
+ wdi_ser['Series Code'] + "?date=" + (wdi_ser['min_year'].astype(str)) + ":" \
+ (wdi_ser['max_year'].astype(str)) + "&format=json"
wdi_ser['url_data_X'] = "https://api.worldbank.org/v2/countries/all/indicators/" \
+ wdi_ser['Series Code'] + "?date=" + (wdi_ser['min_year'].astype(str)) + ":" \
+ (wdi_ser['max_year'].astype(str))
wdi_ser['url_meta_J'] = "https://api.worldbank.org/v2/sources/2/series/" \
+ (wdi_ser['Series Code']).str.lower() + "/metadata?format=json"
wdi_ser['url_meta_X'] = "https://api.worldbank.org/v2/sources/2/series/" \
+ (wdi_ser['Series Code']).str.lower() + "/metadata"
# Add the URL license (series ar CC BY-4.0)
wdi_ser['License Url'] = np.where(wdi_ser['License Type'] == "CC BY-4.0",
"https://creativecommons.org/licenses/by/4.0/", "")
# ------------------------------------------------------------------------------
# GENERATE THE DATABASE-LEVEL METADATA FOR NADA
# ------------------------------------------------------------------------------
database_description = {
'title_statement': {
'idno': src_id,
'title': src_name,
'alternate_title': src_acron
},
'authoring_entity': src_prod,
'abstract': src_descr,
'url': src_url,
'type': "Time series database",
'date_created': src_update,
'date_published': src_update,
'version': src_version,
'update_frequency': src_updfr,
'update_schedule': [{'update': src_updsc}],
'time_coverage': [{'start': str(src_start),
'end': str(src_end)}],
'periodicity': [{'period': src_period}],
'topics': list_topics,
'geographic_units': ctries_l,
'geographic_granularity': "global, national, regional",
'geographic_area_count': str(len(ctries_l)),
'languages': list_lang,
'contacts': [{'name': "Data Help Desk",
'affiliation': "World Bank",
'uri': "https://datahelpdesk.worldbank.org/",
'email': "data@worldbank.org"}],
'access_options': [
{'type': "API", 'uri': "https://datahelpdesk.worldbank.org/knowledgebase/articles/889386"},
{'type': "Bulk", 'uri': "https://data.worldbank.org/data-catalog/world-development-indicators"},
{'type': "Query", 'uri': "http://databank.worldbank.org/data/source/world-development-indicators"},
{'type': "PDF",
'uri': "https://openknowledge.worldbank.org/bitstream/handle/10986/26447/WDI-2017-web.pdf"}],
'license': [{'type': "CC BY-4.0", 'uri': "https://creativecommons.org/licenses/by/4.0/"}],
'citation': src_cite
}
nada.create_timeseries_database(published=1,
overwrite="yes",
database_description=database_description)
# --------------------------------------------------------------------------------------
# GENERATE SERIES-LEVEL METADATA AND PUBLISH IN NADA
# --------------------------------------------------------------------------------------
for index, row in wdi_ser.iterrows():
if row['Series Code'] not in selected_series:
continue
# Get list of countries as list of country codes with no empty element
x = row["countries"].split(" ")
if '' in x: x.remove('')
geo_u = []
for c in x:
for n in ctries:
if c in n:
geo_u.append({"name": n[0], "code": c, "type": ""})
# Split information on topics (make it a list of dictionaries)
list_topics_series = []
top = row["Topic"].split(",")
for t in top:
list_topics_series.append({"id": "", "name": t})
# We add selected keywords where relevant
keyw = []
if "global financial inclusion database" in row['Source'].lower():
keyw.append({"name": "findex"})
if "povcalnet" in row['Source'].lower():
keyw.append({"name": "povcal"})
# Generate series metadata for NADA
series_description = {
"idno": row['Series Code'],
"name": row['Indicator Name'],
"database_id": database_description['title_statement']['idno'],
"measurement_unit": row['Unit of measure'],
"periodicity": row['Periodicity'],
"base_period": row['Base Period'],
"definition_short": row['Short definition'],
"definition_long": row['Long definition'],
"methodology": row['Statistical concept and methodology'],
"limitation": row['Limitations and exceptions'],
"topics": list_topics_series,
"relevance": row['Development relevance'],
"time_periods": [{"start": str(row['min_year']),"end": str(row['max_year'])}],
"geographic_units": geo_u,
"aggregation_method": row['Aggregation method'],
"license": {"type": row['License Type'], "uri": row['License Url']},
"links": [{"type": "API", "description": "Data in JSON", "uri": row['url_data_J']},
{"type": "API", "description": "Data in XML", "uri": row['url_data_X']},
{"type": "API", "description": "Metadata in JSON", "uri": row['url_meta_J']},
{"type": "API", "description": "Metadata in XML", "uri": row['url_meta_X']}],
"api_documentation": {"description": "See the Developer Information webpage for detailed documentation of the "
"API",
"uri": "https://datahelpdesk.worldbank.org/knowledgebase/topics/125589-developer"
"-information"},
"source": row['Source'],
"source_note": row['Notes from original source'],
"keywords": keyw,
"notes": [{"note": row['Other notes']}]
}
# print(series_description)
# We want to apply thumbnails specific to each series
thumb = "thumb_wdi.jpg" # Default thumbnail file
if row['Series Code'] == "SP.POP.TOTL": thumb = "thumb_pop.jpg"
if row['Series Code'] == "SI.POV.DDAY": thumb = "thumb_pov.jpg"
if row['Series Code'] == "NY.GDP.PCAP.KN": thumb = "thumb_eco.jpg"
if row['Series Code'] == "NY.GDP.PCAP.PP.KD": thumb = "thumb_eco.jpg"
if row['Series Code'] == "SP.DYN.IMRT.IN": thumb = "thumb_hea.jpg"
if row['Series Code'] == "SP.POP.DPND": thumb = "thumb_dep.jpg"
# Publish the metadata in NADA
nada.create_timeseries_dataset(dataset_id=series_description['idno'],
repository_id="central",
published=1,
overwrite="yes",
series_description=series_description
)
nada.upload_thumbnail(dataset_id=series_description['idno'], file_path=thumb)Making the data accessible via API
@@@@ Data can be published and made accessible via API. See section ...
Adding data visualizations
When data are made accessible via API (or when the dataset is small enough to be embedded in a visualization script), you may add interactive visualizations (charts, maps) in the series' metadata page. The visualizations are generated using external charting or mapping tools, so there is considerable flexibility in the type of visualizations you can embed in a NADA page. The example below provides a very simple example (line chart) developed using eCharts, an open source JavaScript library developed by Baidu and published by the Apache Foundation.
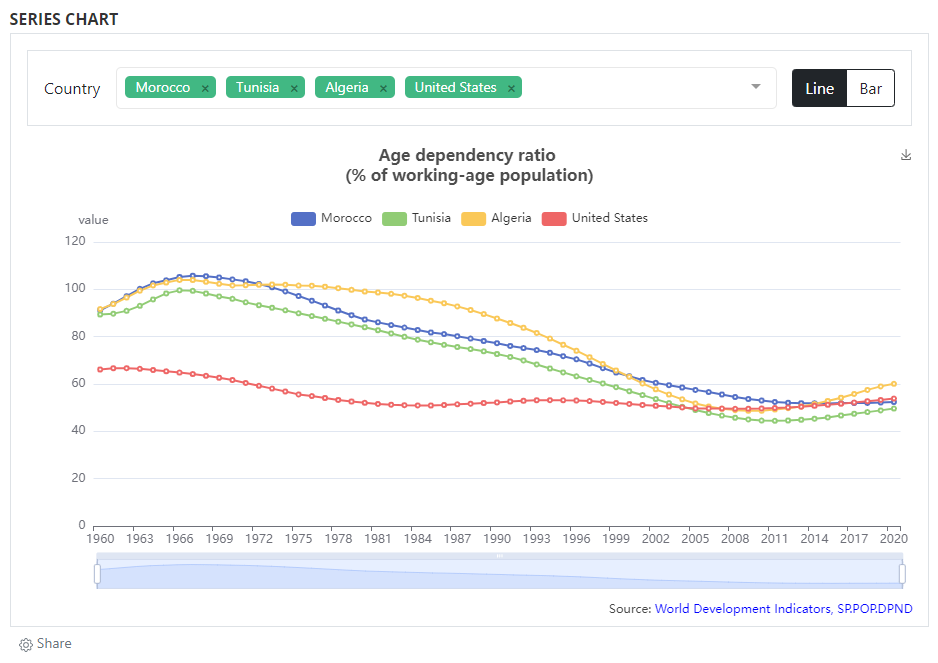
Adding visualizations is done by using widgets. See section ...
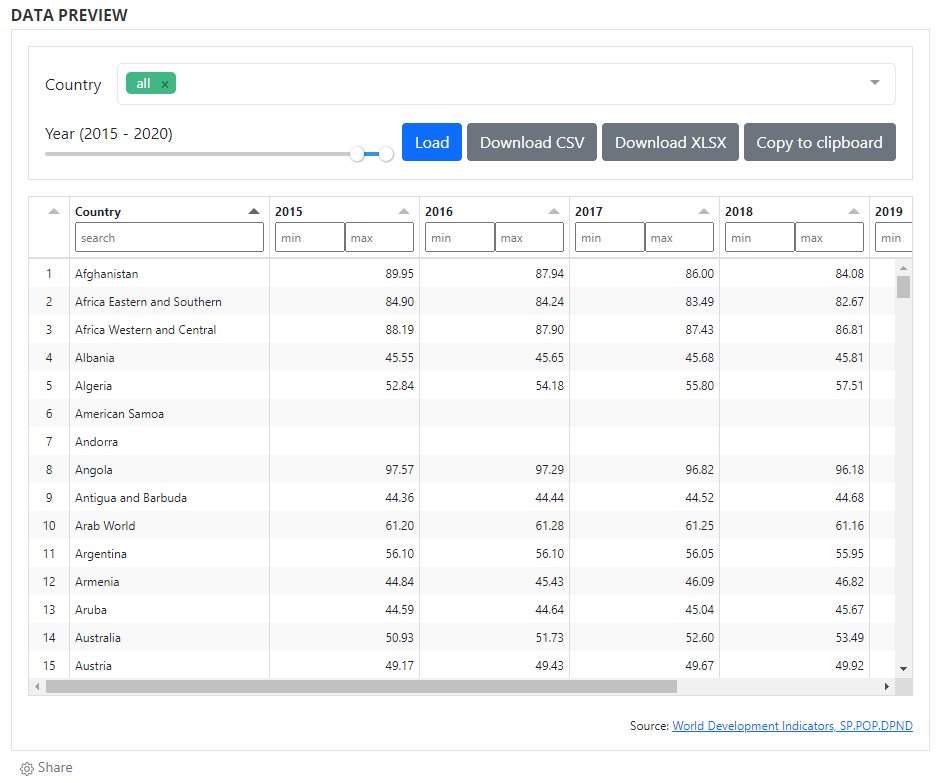
Adding a data preview
When data are made accessible via API, they can also be displayed and made searchable in a data (pre)view grid. As for data visualizations, this option makes use of external tools and of the widget solution, to provide maximum flexibility to catalog administrators. Multiple open source JavaScript grid applications are availble, as well as commercial ones. The example below makes use of the ... library. For information on how to implement widgets, see section ...