Indicators — Catalog frontend
Also see Publishing indicators and Admin UI.
When an indicator project is published, users can explore it through a dedicated study detail page in the catalog. The page is organized into five tabs.
Series description
The Series Description tab is the default view. It displays the full indicator metadata organized into sub-sections accessible from the left navigation panel:
- Overview — Series unique ID, series name, linked dataset, periodicity, definition, and other key fields.
- Geographic information — Countries and regions covered.
- API documentation — Instructions for accessing the data via the API.
- Metadata production — Provenance of the metadata record.
The page header shows the indicator title, the list of countries and years covered, the Reference ID, the parent dataset, and a link to download the metadata as JSON.
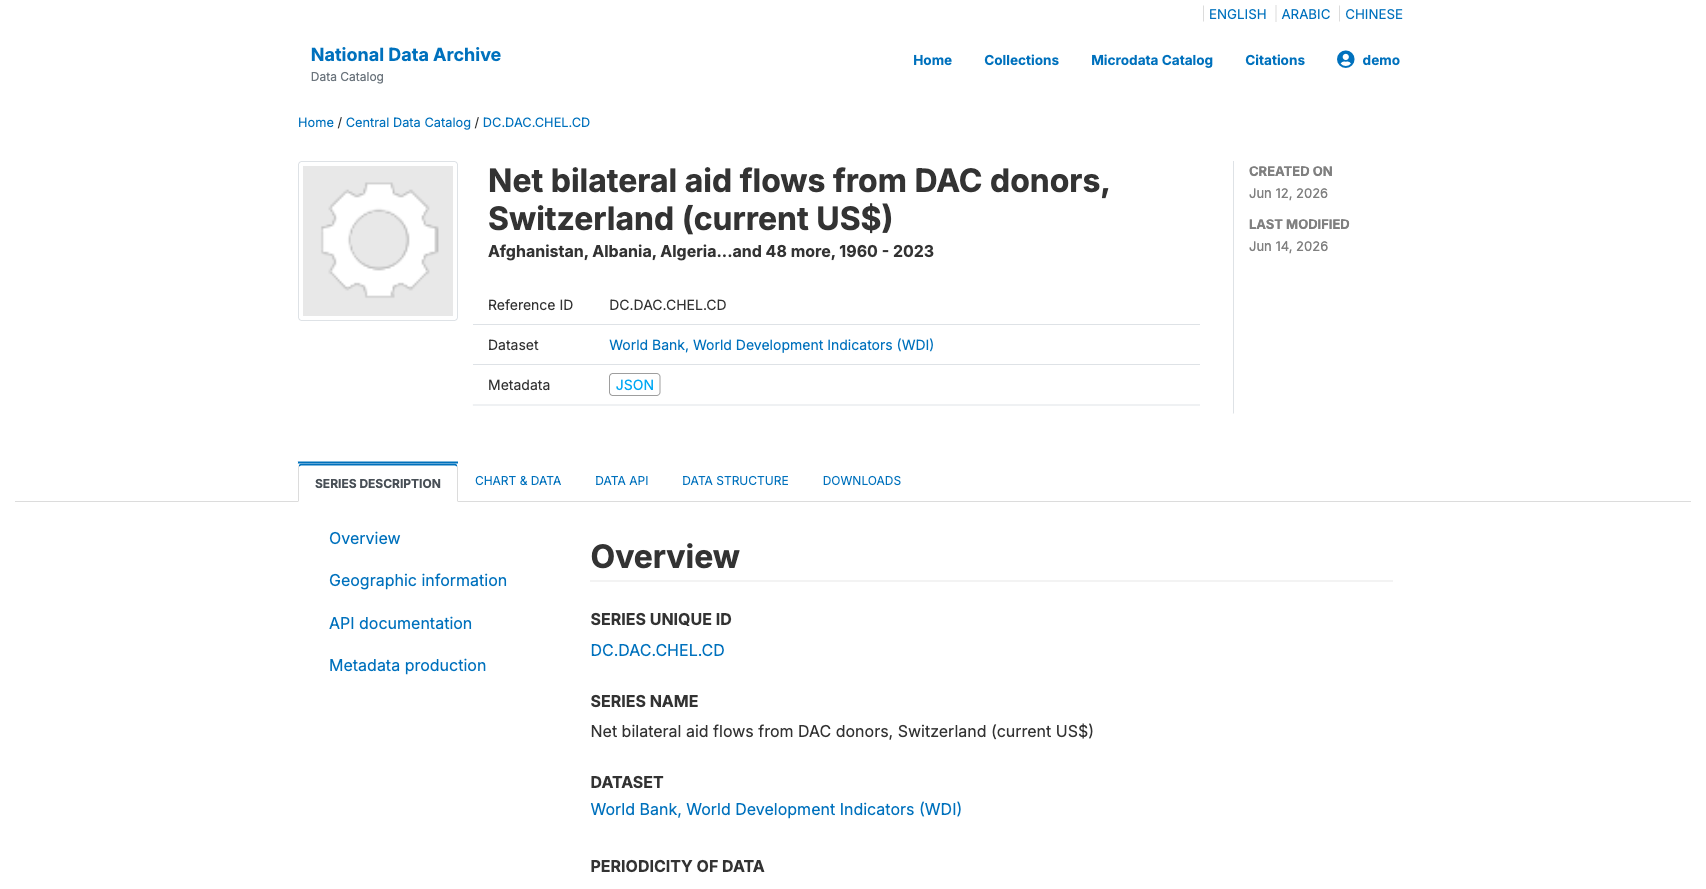
Chart & data
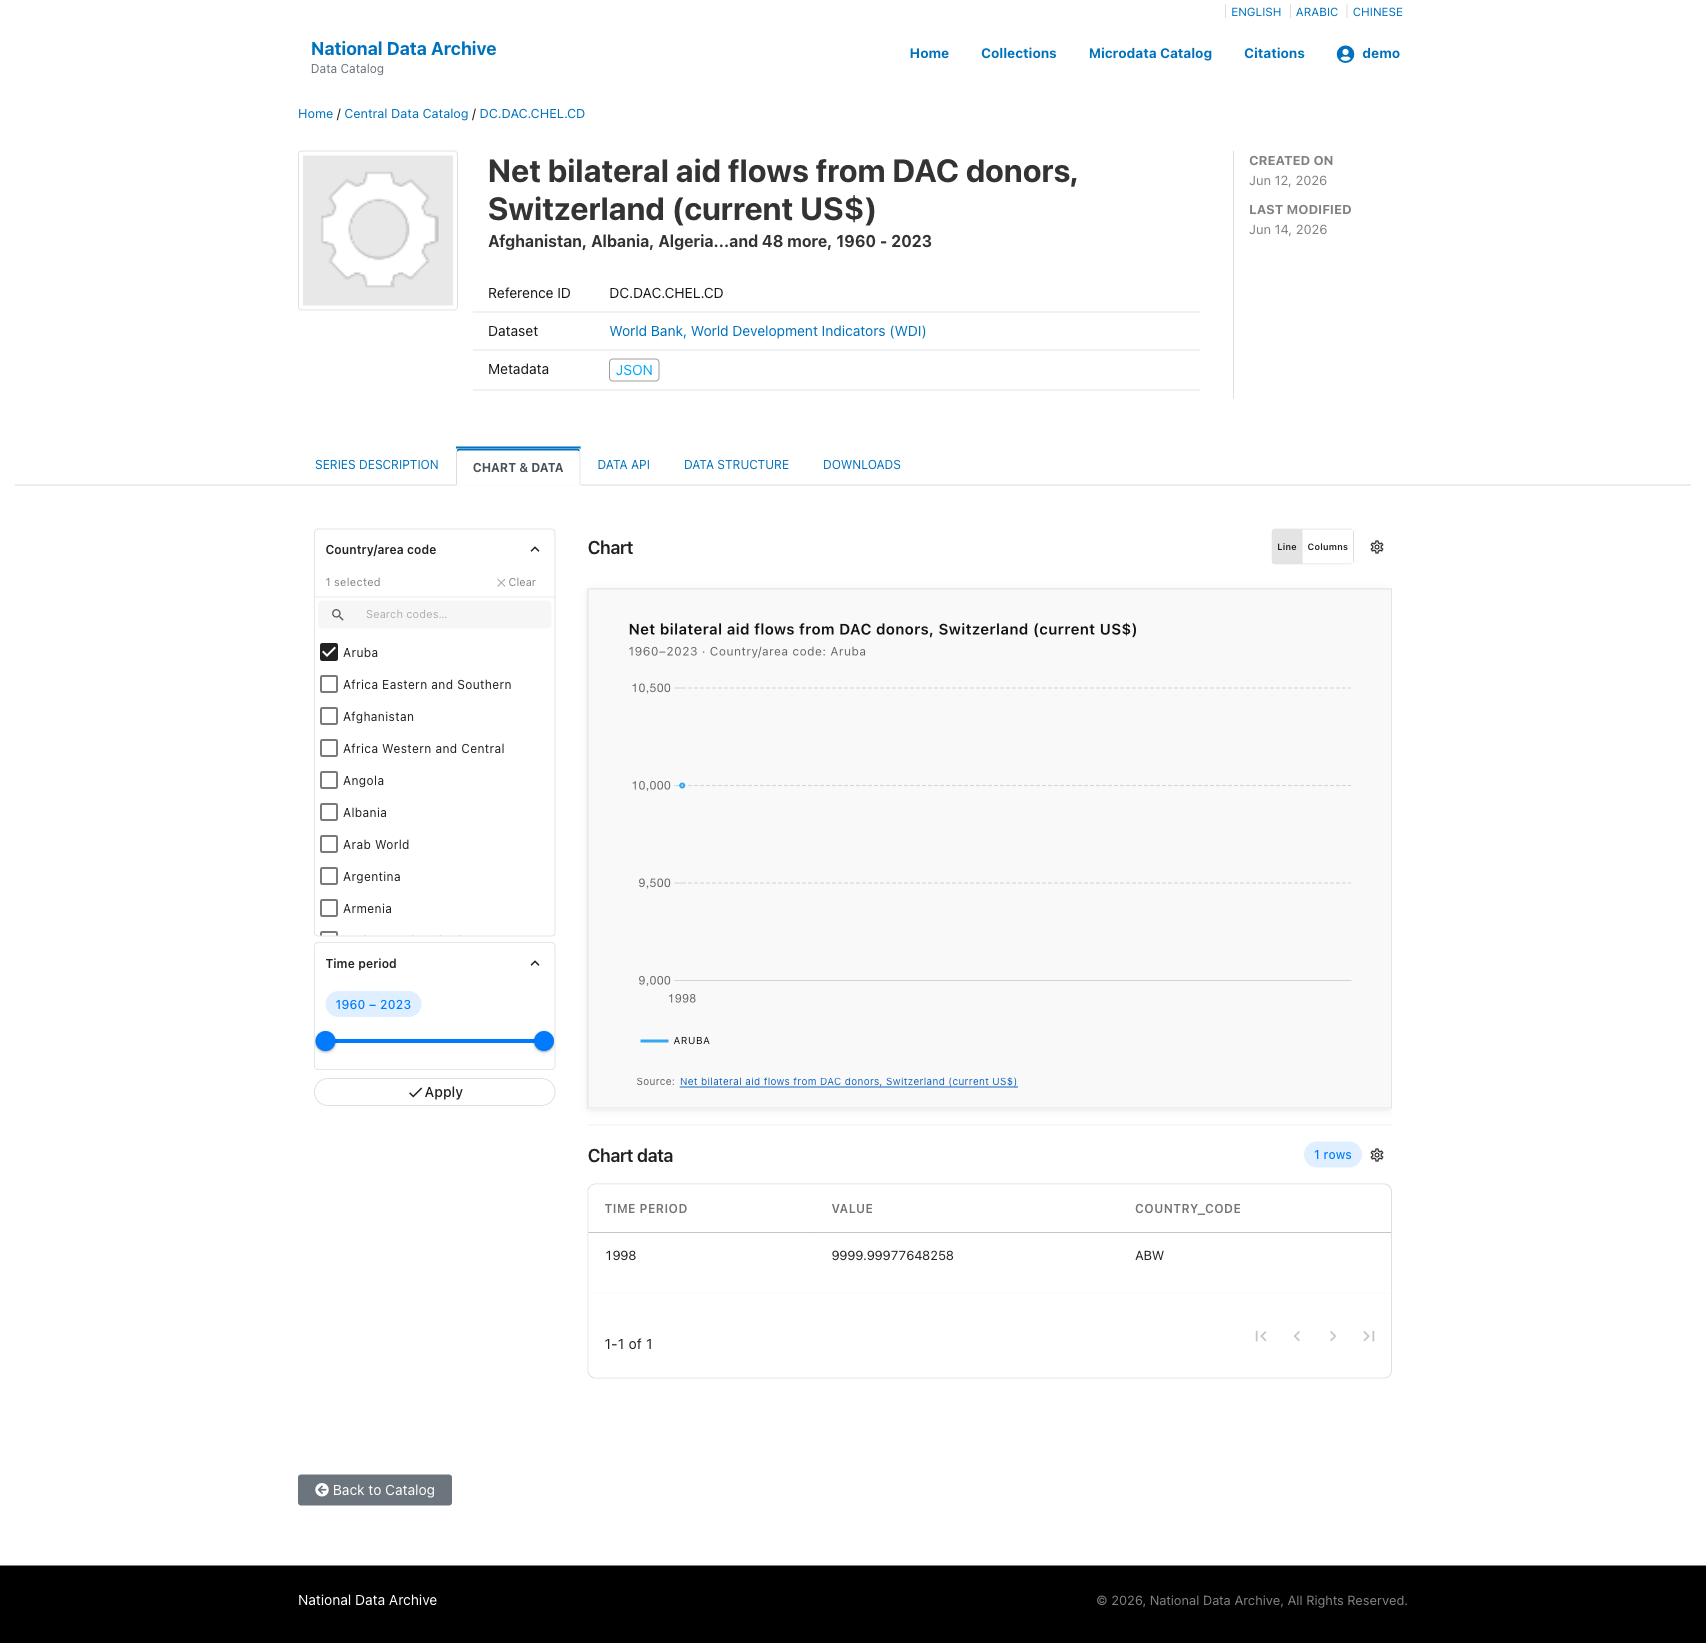
The Chart & Data tab lets users explore the indicator data interactively.
On the left, a filter panel exposes all dimension columns defined in the DSD — for example, Country/area code (a searchable checklist) and Time period (a range slider). Click Apply to refresh the chart and data table with the selected filters.
On the right, the chart displays the filtered data as a line or column chart (toggle with the Line / Columns buttons). The chart title, subtitle, and source attribution are shown automatically.
Below the chart, the Chart data table shows the raw values for the current selection, with columns for TIME_PERIOD, VALUE, and the dimension codes. Pagination controls allow browsing all matching rows.
Data API
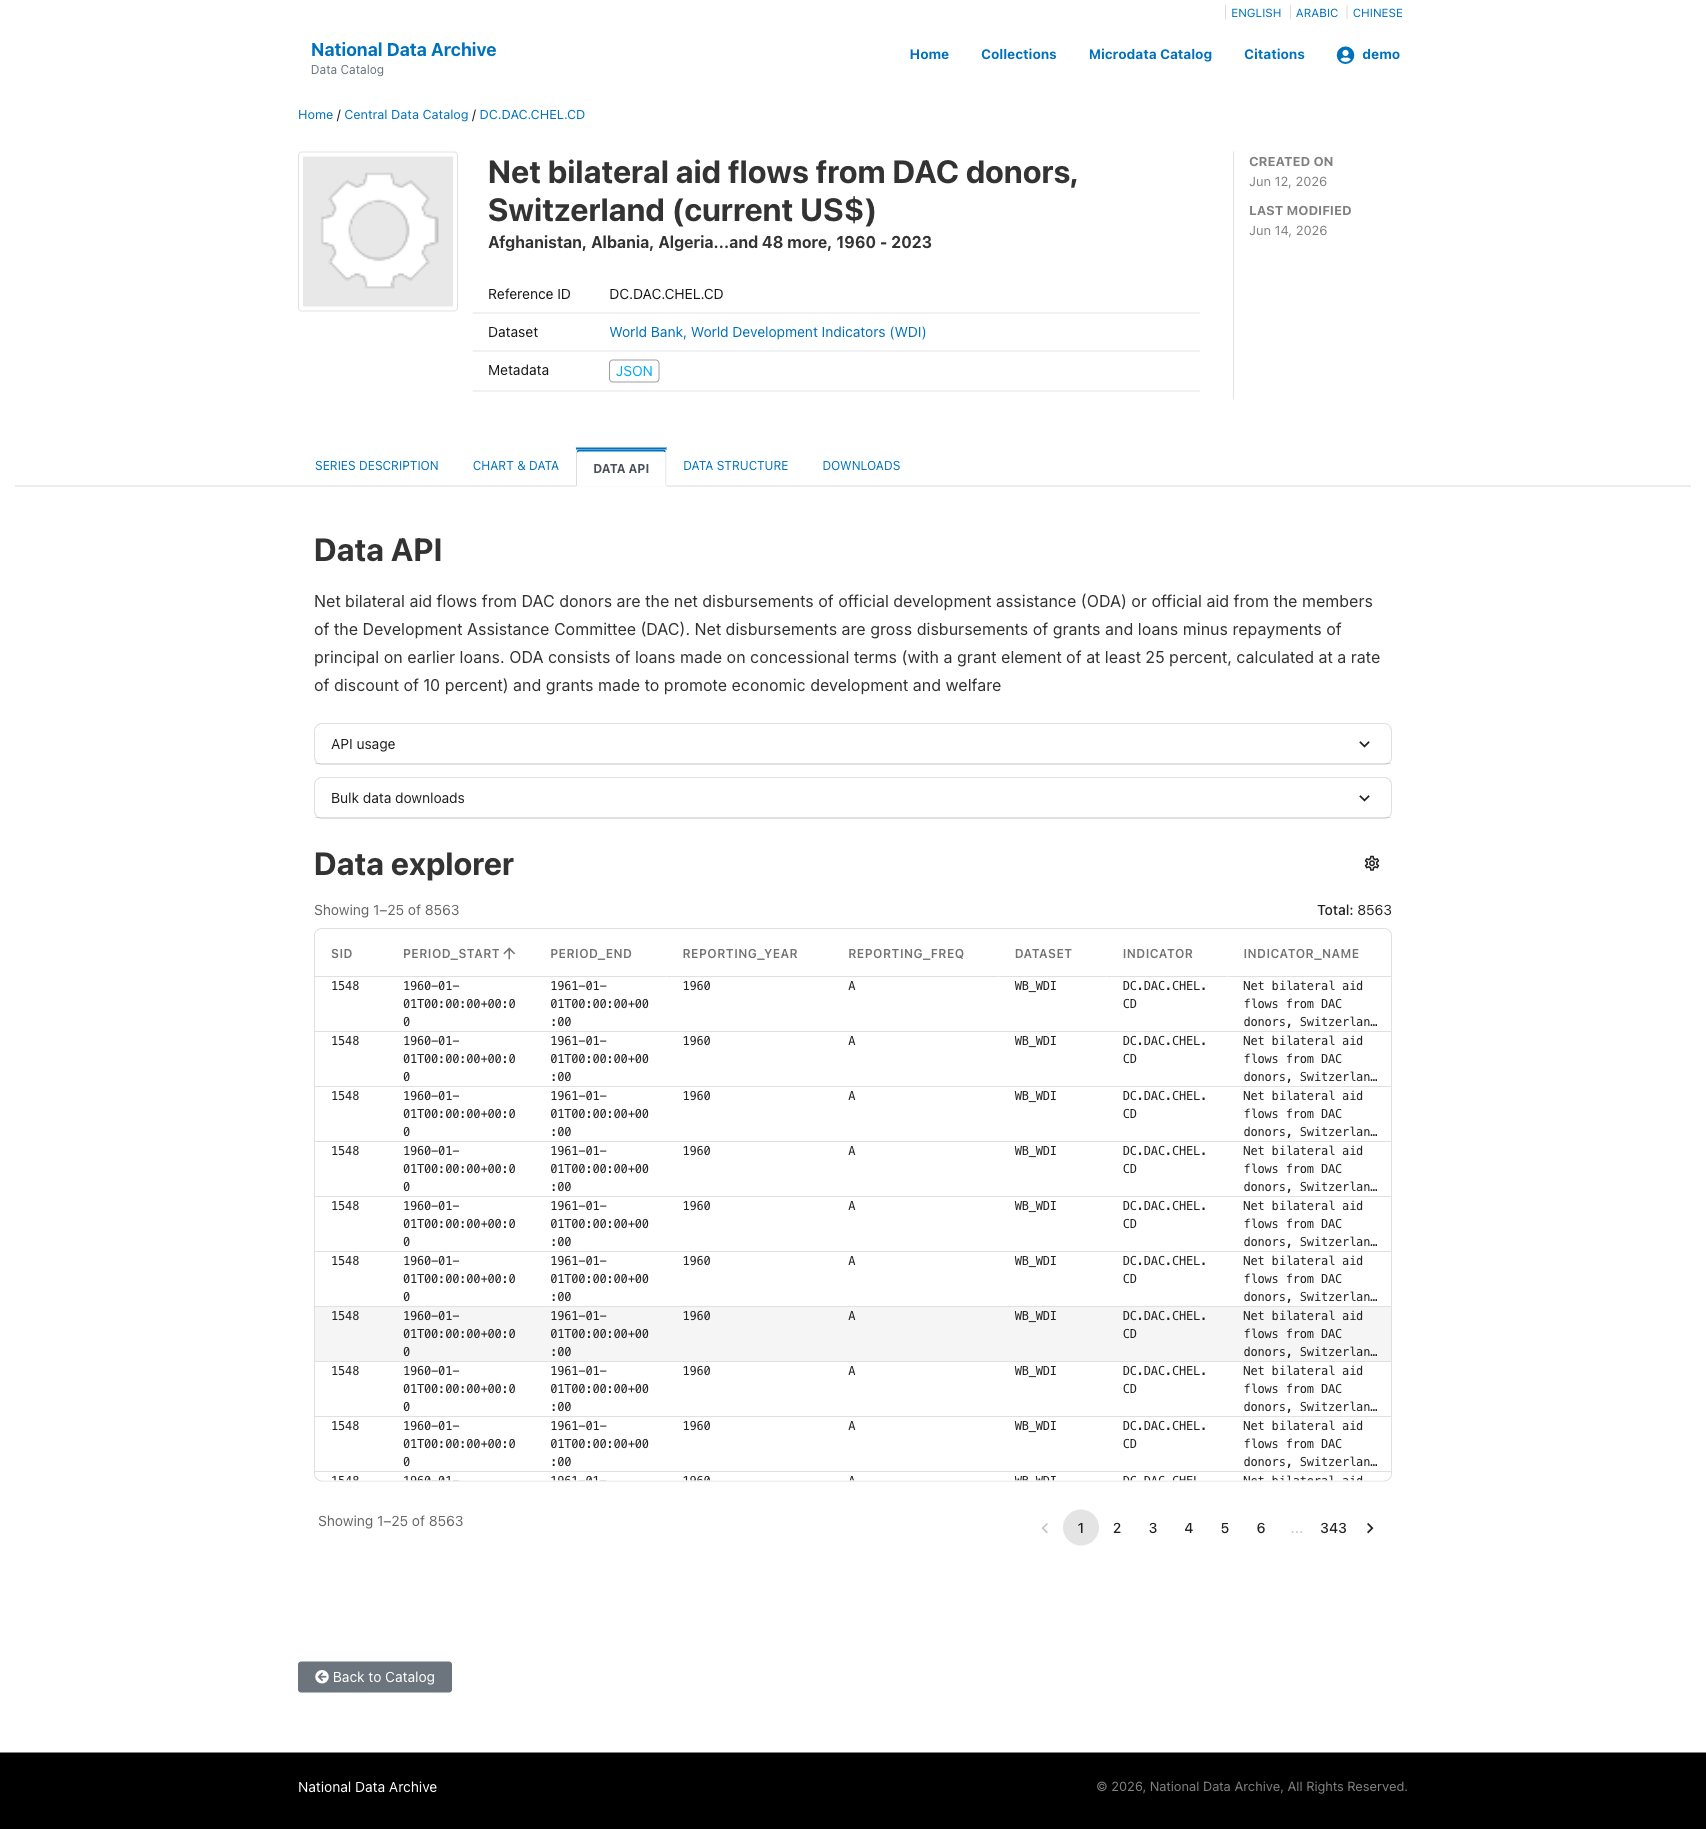
The Data API tab provides documentation and an interactive data explorer for programmatic access to the indicator data.
The tab includes:
- A description of the indicator series.
- API usage — Expandable section with example API calls and parameter documentation.
- Bulk data downloads — Links to download the full dataset.
- Data explorer — An inline table showing all data rows (DATASET, INDICATOR, INDICATOR_NAME, COUNTRY_CODE, FREQ, TIME_PERIOD, OBS_VALUE), with pagination.
Data structure
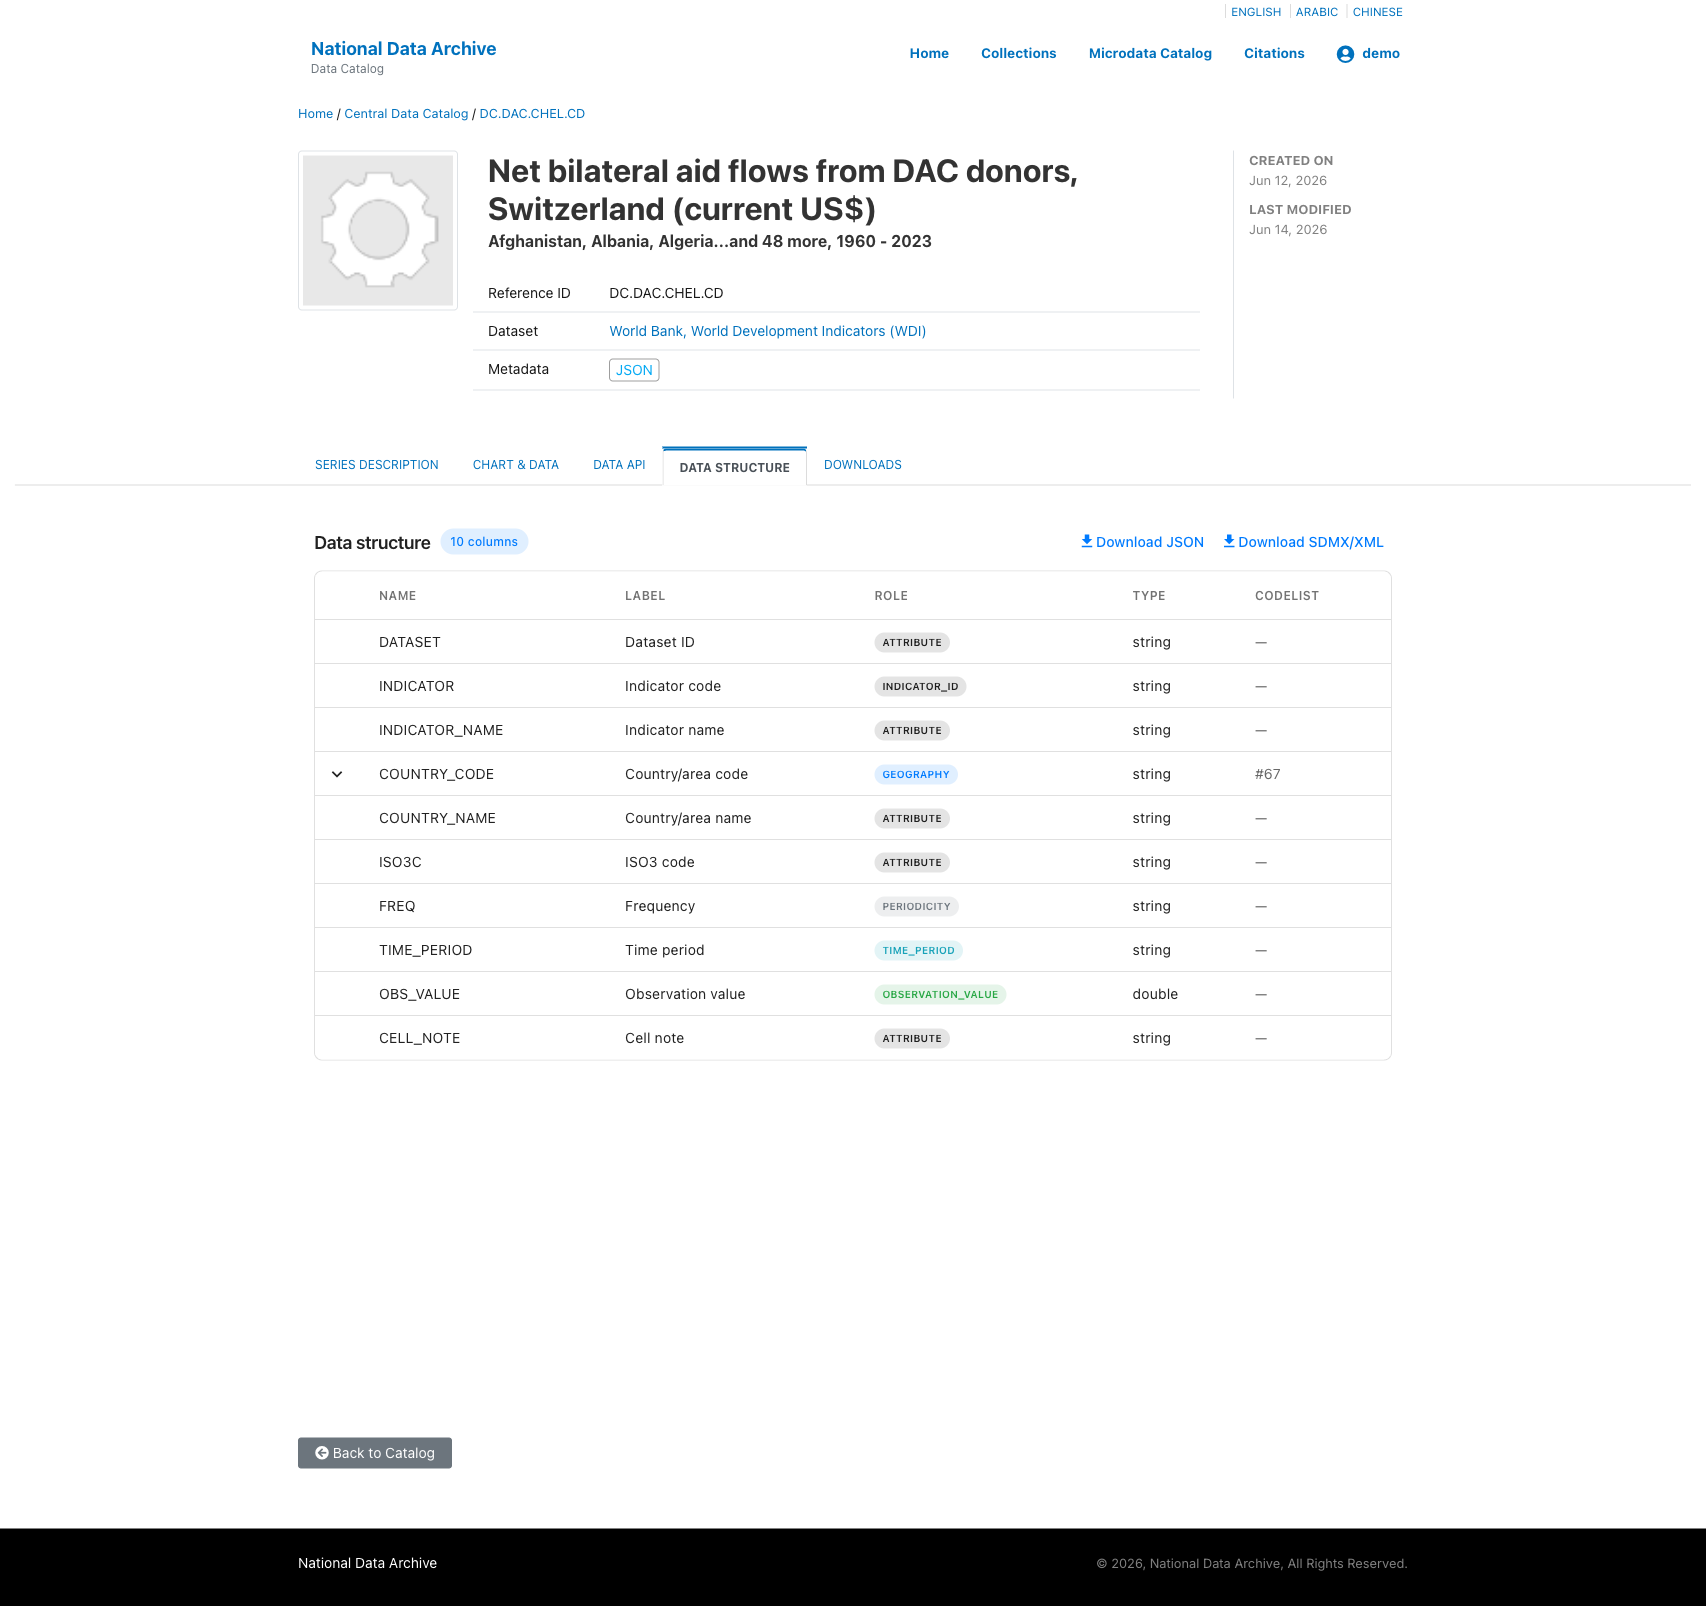
The Data Structure tab documents the structure of the dataset so users understand the columns and their meaning before working with the data programmatically.
The table lists all columns in the DSD with:
- Name — the column identifier used in the CSV and API.
- Label — a human-readable description of the column.
- Role — the semantic role of the column, displayed as a colour-coded badge (e.g. ATTRIBUTE, INDICATOR_ID, GEOGRAPHY, PERIODICITY, TIME_PERIOD, OBSERVATION_VALUE).
- Type — the data type (string, double, integer, etc.).
- Codelist — the linked codelist ID, if applicable. Click the expand arrow to view the codelist codes inline.
Use the Download JSON or Download SDMX/XML buttons to download the full DSD definition.
Downloads
The Downloads tab lists any related resources (files or links) attached to the indicator entry by the catalog administrator, such as documentation, methodology notes, or supplementary data files.
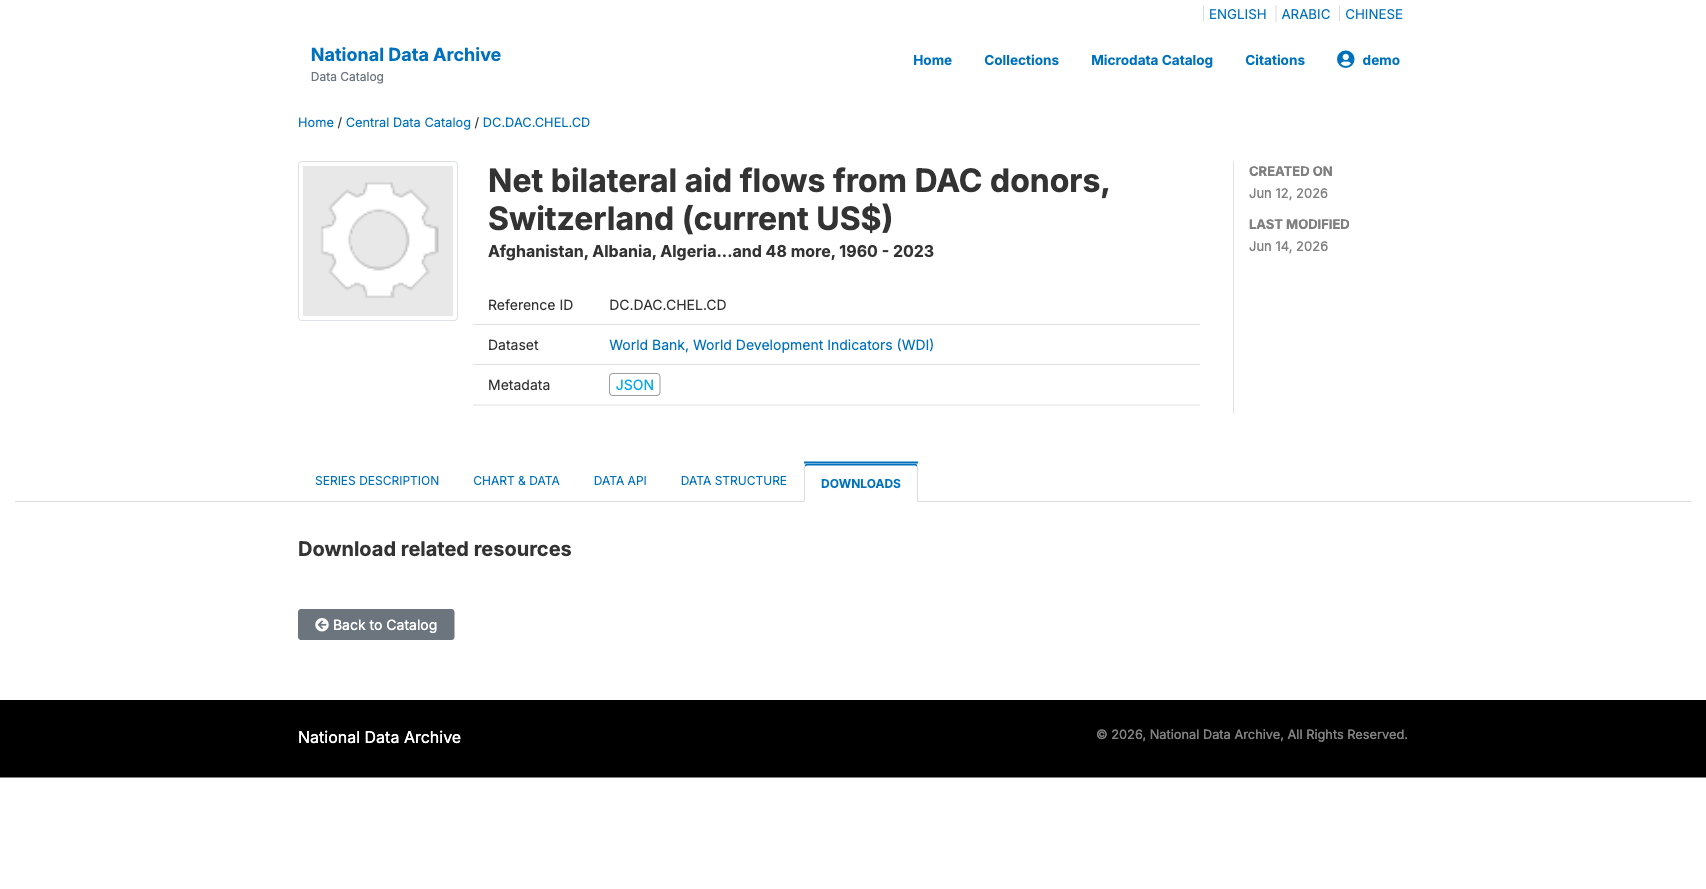
If no resources have been attached, this tab will appear empty.